- India
- /
- Entertainment
- /
- NSEI:SILLYMONKS
Does The Market Have A Low Tolerance For Silly Monks Entertainment Limited's (NSE:SILLYMONKS) Mixed Fundamentals?

It is hard to get excited after looking at Silly Monks Entertainment's (NSE:SILLYMONKS) recent performance, when its stock has declined 27% over the past three months. We, however decided to study the company's financials to determine if they have got anything to do with the price decline. Fundamentals usually dictate market outcomes so it makes sense to study the company's financials. Particularly, we will be paying attention to Silly Monks Entertainment's ROE today.
Return on Equity or ROE is a test of how effectively a company is growing its value and managing investors’ money. Simply put, it is used to assess the profitability of a company in relation to its equity capital.
How Do You Calculate Return On Equity?
The formula for return on equity is:
Return on Equity = Net Profit (from continuing operations) ÷ Shareholders' Equity
So, based on the above formula, the ROE for Silly Monks Entertainment is:
4.2% = ₹3.2m ÷ ₹75m (Based on the trailing twelve months to December 2024).
The 'return' is the amount earned after tax over the last twelve months. So, this means that for every ₹1 of its shareholder's investments, the company generates a profit of ₹0.04.
See our latest analysis for Silly Monks Entertainment
Why Is ROE Important For Earnings Growth?
So far, we've learned that ROE is a measure of a company's profitability. Depending on how much of these profits the company reinvests or "retains", and how effectively it does so, we are then able to assess a company’s earnings growth potential. Assuming everything else remains unchanged, the higher the ROE and profit retention, the higher the growth rate of a company compared to companies that don't necessarily bear these characteristics.
A Side By Side comparison of Silly Monks Entertainment's Earnings Growth And 4.2% ROE
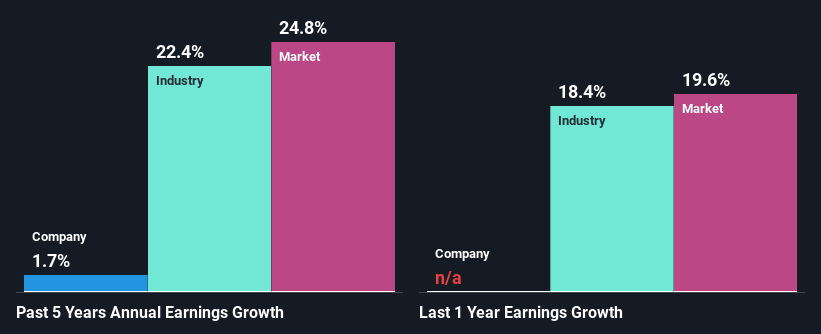
It is quite clear that Silly Monks Entertainment's ROE is rather low. Even when compared to the industry average of 5.8%, the ROE figure is pretty disappointing. Therefore, Silly Monks Entertainment's flat earnings over the past five years can possibly be explained by the low ROE amongst other factors.
We then compared Silly Monks Entertainment's net income growth with the industry and found that the company's growth figure is lower than the average industry growth rate of 22% in the same 5-year period, which is a bit concerning.
The basis for attaching value to a company is, to a great extent, tied to its earnings growth. The investor should try to establish if the expected growth or decline in earnings, whichever the case may be, is priced in. By doing so, they will have an idea if the stock is headed into clear blue waters or if swampy waters await. If you're wondering about Silly Monks Entertainment's's valuation, check out this gauge of its price-to-earnings ratio , as compared to its industry.
Is Silly Monks Entertainment Making Efficient Use Of Its Profits?
Silly Monks Entertainment doesn't pay any regular dividends, meaning that potentially all of its profits are being reinvested in the business. However, this doesn't explain why the company hasn't seen any growth. So there could be some other explanations in that regard. For instance, the company's business may be deteriorating.
Conclusion
On the whole, we feel that the performance shown by Silly Monks Entertainment can be open to many interpretations. While the company does have a high rate of profit retention, its low rate of return is probably hampering its earnings growth. So far, we've only made a quick discussion around the company's earnings growth. To gain further insights into Silly Monks Entertainment's past profit growth, check out this visualization of past earnings, revenue and cash flows.
Mobile Infrastructure for Defense and Disaster
The next wave in robotics isn't humanoid. Its fully autonomous towers delivering 5G, ISR, and radar in under 30 minutes, anywhere.
Get the investor briefing before the next round of contracts
Sponsored On Behalf of CiTechNew: Manage All Your Stock Portfolios in One Place
We've created the ultimate portfolio companion for stock investors, and it's free.
• Connect an unlimited number of Portfolios and see your total in one currency
• Be alerted to new Warning Signs or Risks via email or mobile
• Track the Fair Value of your stocks
Have feedback on this article? Concerned about the content? Get in touch with us directly. Alternatively, email editorial-team (at) simplywallst.com.
This article by Simply Wall St is general in nature. We provide commentary based on historical data and analyst forecasts only using an unbiased methodology and our articles are not intended to be financial advice. It does not constitute a recommendation to buy or sell any stock, and does not take account of your objectives, or your financial situation. We aim to bring you long-term focused analysis driven by fundamental data. Note that our analysis may not factor in the latest price-sensitive company announcements or qualitative material. Simply Wall St has no position in any stocks mentioned.
About NSEI:SILLYMONKS
Silly Monks Entertainment
Engages in content production, marketing, and distribution on digital media and traditional mediums in India and internationally.
Flawless balance sheet with low risk.
Market Insights

Weekly Picks

THE KINGDOM OF BROWN GOODS: WHY MGPI IS BEING CRUSHED BY INVENTORY & PRIMED FOR RESURRECTION


Why Vertical Aerospace (NYSE: EVTL) is Worth Possibly Over 13x its Current Price


The Quiet Giant That Became AI’s Power Grid
Recently Updated Narratives


MINISO's fair value is projected at 26.69 with an anticipated PE ratio shift of 20x

Fiverr International will transform the freelance industry with AI-powered growth

Stride Stock: Online Education Finds Its Second Act
Popular Narratives


MicroVision will explode future revenue by 380.37% with a vision towards success


Crazy Undervalued 42 Baggers Silver Play (Active & Running Mine)


