- India
- /
- Basic Materials
- /
- NSEI:RAMCOCEM
A Look At The Intrinsic Value Of The Ramco Cements Limited (NSE:RAMCOCEM)

Key Insights
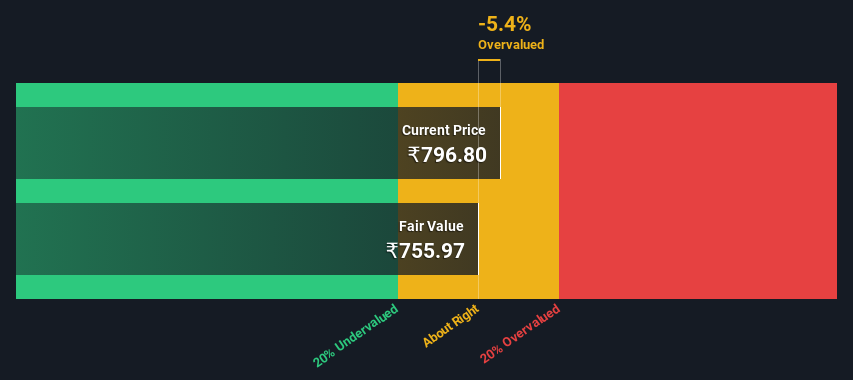
- Using the 2 Stage Free Cash Flow to Equity, Ramco Cements fair value estimate is ₹756
- Current share price of ₹797 suggests Ramco Cements is potentially trading close to its fair value
- The ₹902 analyst price target for RAMCOCEM is 19% more than our estimate of fair value
Today we will run through one way of estimating the intrinsic value of The Ramco Cements Limited (NSE:RAMCOCEM) by estimating the company's future cash flows and discounting them to their present value. Our analysis will employ the Discounted Cash Flow (DCF) model. Before you think you won't be able to understand it, just read on! It's actually much less complex than you'd imagine.
Remember though, that there are many ways to estimate a company's value, and a DCF is just one method. Anyone interested in learning a bit more about intrinsic value should have a read of the Simply Wall St analysis model.
View our latest analysis for Ramco Cements
The Method
We're using the 2-stage growth model, which simply means we take in account two stages of company's growth. In the initial period the company may have a higher growth rate and the second stage is usually assumed to have a stable growth rate. In the first stage we need to estimate the cash flows to the business over the next ten years. Where possible we use analyst estimates, but when these aren't available we extrapolate the previous free cash flow (FCF) from the last estimate or reported value. We assume companies with shrinking free cash flow will slow their rate of shrinkage, and that companies with growing free cash flow will see their growth rate slow, over this period. We do this to reflect that growth tends to slow more in the early years than it does in later years.
Generally we assume that a dollar today is more valuable than a dollar in the future, so we need to discount the sum of these future cash flows to arrive at a present value estimate:
10-year free cash flow (FCF) forecast
| 2025 | 2026 | 2027 | 2028 | 2029 | 2030 | 2031 | 2032 | 2033 | 2034 | |
| Levered FCF (₹, Millions) | ₹3.44b | ₹7.46b | ₹11.4b | ₹14.7b | ₹18.0b | ₹21.1b | ₹24.1b | ₹27.0b | ₹29.8b | ₹32.6b |
| Growth Rate Estimate Source | Analyst x7 | Analyst x10 | Analyst x3 | Est @ 28.89% | Est @ 22.23% | Est @ 17.57% | Est @ 14.30% | Est @ 12.02% | Est @ 10.42% | Est @ 9.30% |
| Present Value (₹, Millions) Discounted @ 15% | ₹3.0k | ₹5.6k | ₹7.5k | ₹8.4k | ₹8.9k | ₹9.1k | ₹9.0k | ₹8.8k | ₹8.4k | ₹8.0k |
("Est" = FCF growth rate estimated by Simply Wall St)
Present Value of 10-year Cash Flow (PVCF) = ₹77b
We now need to calculate the Terminal Value, which accounts for all the future cash flows after this ten year period. The Gordon Growth formula is used to calculate Terminal Value at a future annual growth rate equal to the 5-year average of the 10-year government bond yield of 6.7%. We discount the terminal cash flows to today's value at a cost of equity of 15%.
Terminal Value (TV)= FCF2034 × (1 + g) ÷ (r – g) = ₹33b× (1 + 6.7%) ÷ (15%– 6.7%) = ₹415b
Present Value of Terminal Value (PVTV)= TV / (1 + r)10= ₹415b÷ ( 1 + 15%)10= ₹102b
The total value, or equity value, is then the sum of the present value of the future cash flows, which in this case is ₹179b. To get the intrinsic value per share, we divide this by the total number of shares outstanding. Compared to the current share price of ₹797, the company appears around fair value at the time of writing. Valuations are imprecise instruments though, rather like a telescope - move a few degrees and end up in a different galaxy. Do keep this in mind.
Important Assumptions
Now the most important inputs to a discounted cash flow are the discount rate, and of course, the actual cash flows. You don't have to agree with these inputs, I recommend redoing the calculations yourself and playing with them. The DCF also does not consider the possible cyclicality of an industry, or a company's future capital requirements, so it does not give a full picture of a company's potential performance. Given that we are looking at Ramco Cements as potential shareholders, the cost of equity is used as the discount rate, rather than the cost of capital (or weighted average cost of capital, WACC) which accounts for debt. In this calculation we've used 15%, which is based on a levered beta of 1.074. Beta is a measure of a stock's volatility, compared to the market as a whole. We get our beta from the industry average beta of globally comparable companies, with an imposed limit between 0.8 and 2.0, which is a reasonable range for a stable business.
SWOT Analysis for Ramco Cements
- Earnings growth over the past year exceeded its 5-year average.
- Debt is well covered by cash flow.
- Earnings growth over the past year underperformed the Basic Materials industry.
- Interest payments on debt are not well covered.
- Dividend is low compared to the top 25% of dividend payers in the Basic Materials market.
- Expensive based on P/E ratio and estimated fair value.
- Annual earnings are forecast to grow faster than the Indian market.
- Paying a dividend but company has no free cash flows.
- Annual revenue is forecast to grow slower than the Indian market.
Looking Ahead:
Although the valuation of a company is important, it is only one of many factors that you need to assess for a company. DCF models are not the be-all and end-all of investment valuation. Rather it should be seen as a guide to "what assumptions need to be true for this stock to be under/overvalued?" For instance, if the terminal value growth rate is adjusted slightly, it can dramatically alter the overall result. For Ramco Cements, we've compiled three fundamental aspects you should further research:
- Risks: For example, we've discovered 2 warning signs for Ramco Cements (1 doesn't sit too well with us!) that you should be aware of before investing here.
- Future Earnings: How does RAMCOCEM's growth rate compare to its peers and the wider market? Dig deeper into the analyst consensus number for the upcoming years by interacting with our free analyst growth expectation chart.
- Other High Quality Alternatives: Do you like a good all-rounder? Explore our interactive list of high quality stocks to get an idea of what else is out there you may be missing!
PS. Simply Wall St updates its DCF calculation for every Indian stock every day, so if you want to find the intrinsic value of any other stock just search here.
The New Payments ETF Is Live on NASDAQ:
Money is moving to real-time rails, and a newly listed ETF now gives investors direct exposure. Fast settlement. Institutional custody. Simple access.
Explore how this launch could reshape portfolios
Sponsored ContentNew: AI Stock Screener & Alerts
Our new AI Stock Screener scans the market every day to uncover opportunities.
• Dividend Powerhouses (3%+ Yield)
• Undervalued Small Caps with Insider Buying
• High growth Tech and AI Companies
Or build your own from over 50 metrics.
Have feedback on this article? Concerned about the content? Get in touch with us directly. Alternatively, email editorial-team (at) simplywallst.com.
This article by Simply Wall St is general in nature. We provide commentary based on historical data and analyst forecasts only using an unbiased methodology and our articles are not intended to be financial advice. It does not constitute a recommendation to buy or sell any stock, and does not take account of your objectives, or your financial situation. We aim to bring you long-term focused analysis driven by fundamental data. Note that our analysis may not factor in the latest price-sensitive company announcements or qualitative material. Simply Wall St has no position in any stocks mentioned.
Have feedback on this article? Concerned about the content? Get in touch with us directly. Alternatively, email editorial-team@simplywallst.com
About NSEI:RAMCOCEM
Ramco Cements
Manufactures and sells cement and construction Chemicals in India.
Reasonable growth potential with acceptable track record.
Similar Companies
Market Insights

Weekly Picks

THE KINGDOM OF BROWN GOODS: WHY MGPI IS BEING CRUSHED BY INVENTORY & PRIMED FOR RESURRECTION


Why Vertical Aerospace (NYSE: EVTL) is Worth Possibly Over 13x its Current Price


The Quiet Giant That Became AI’s Power Grid
Recently Updated Narratives


A tech powerhouse quietly powering the world’s AI infrastructure.


Keppel DC REIT (SGX: AJBU) is a resilient gem in the data center space.
Why Vertical Aerospace (NYSE: EVTL) is Worth Possibly Over 13x its Current Price
Popular Narratives

MicroVision will explode future revenue by 380.37% with a vision towards success


Crazy Undervalued 42 Baggers Silver Play (Active & Running Mine)


