- India
- /
- Metals and Mining
- /
- NSEI:RAJRATAN
Is Rajratan Global Wire Limited (NSE:RAJRATAN) Expensive For A Reason? A Look At Its Intrinsic Value

Key Insights
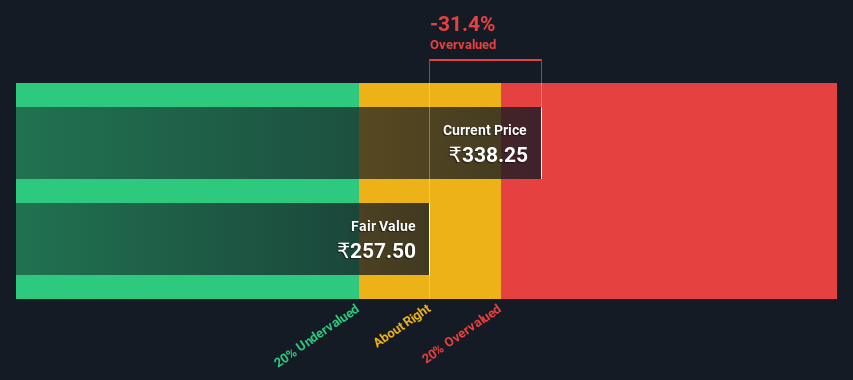
- Using the 2 Stage Free Cash Flow to Equity, Rajratan Global Wire fair value estimate is ₹257
- Current share price of ₹338 suggests Rajratan Global Wire is potentially 31% overvalued
- Analyst price target for RAJRATAN is ₹616, which is 139% above our fair value estimate
Today we will run through one way of estimating the intrinsic value of Rajratan Global Wire Limited (NSE:RAJRATAN) by taking the forecast future cash flows of the company and discounting them back to today's value. Our analysis will employ the Discounted Cash Flow (DCF) model. Before you think you won't be able to understand it, just read on! It's actually much less complex than you'd imagine.
We would caution that there are many ways of valuing a company and, like the DCF, each technique has advantages and disadvantages in certain scenarios. Anyone interested in learning a bit more about intrinsic value should have a read of the Simply Wall St analysis model.
View our latest analysis for Rajratan Global Wire
The Calculation
We are going to use a two-stage DCF model, which, as the name states, takes into account two stages of growth. The first stage is generally a higher growth period which levels off heading towards the terminal value, captured in the second 'steady growth' period. In the first stage we need to estimate the cash flows to the business over the next ten years. Where possible we use analyst estimates, but when these aren't available we extrapolate the previous free cash flow (FCF) from the last estimate or reported value. We assume companies with shrinking free cash flow will slow their rate of shrinkage, and that companies with growing free cash flow will see their growth rate slow, over this period. We do this to reflect that growth tends to slow more in the early years than it does in later years.
Generally we assume that a dollar today is more valuable than a dollar in the future, and so the sum of these future cash flows is then discounted to today's value:
10-year free cash flow (FCF) forecast
| 2025 | 2026 | 2027 | 2028 | 2029 | 2030 | 2031 | 2032 | 2033 | 2034 | |
| Levered FCF (₹, Millions) | ₹248.0m | ₹758.3m | ₹1.00b | ₹1.20b | ₹1.39b | ₹1.58b | ₹1.76b | ₹1.93b | ₹2.10b | ₹2.28b |
| Growth Rate Estimate Source | Analyst x3 | Analyst x3 | Analyst x2 | Est @ 19.92% | Est @ 15.96% | Est @ 13.19% | Est @ 11.25% | Est @ 9.89% | Est @ 8.94% | Est @ 8.27% |
| Present Value (₹, Millions) Discounted @ 15% | ₹215 | ₹573 | ₹658 | ₹686 | ₹691 | ₹679 | ₹657 | ₹627 | ₹593 | ₹558 |
("Est" = FCF growth rate estimated by Simply Wall St)
Present Value of 10-year Cash Flow (PVCF) = ₹5.9b
We now need to calculate the Terminal Value, which accounts for all the future cash flows after this ten year period. The Gordon Growth formula is used to calculate Terminal Value at a future annual growth rate equal to the 5-year average of the 10-year government bond yield of 6.7%. We discount the terminal cash flows to today's value at a cost of equity of 15%.
Terminal Value (TV)= FCF2034 × (1 + g) ÷ (r – g) = ₹2.3b× (1 + 6.7%) ÷ (15%– 6.7%) = ₹29b
Present Value of Terminal Value (PVTV)= TV / (1 + r)10= ₹29b÷ ( 1 + 15%)10= ₹7.1b
The total value is the sum of cash flows for the next ten years plus the discounted terminal value, which results in the Total Equity Value, which in this case is ₹13b. To get the intrinsic value per share, we divide this by the total number of shares outstanding. Relative to the current share price of ₹338, the company appears potentially overvalued at the time of writing. The assumptions in any calculation have a big impact on the valuation, so it is better to view this as a rough estimate, not precise down to the last cent.
Important Assumptions
The calculation above is very dependent on two assumptions. The first is the discount rate and the other is the cash flows. Part of investing is coming up with your own evaluation of a company's future performance, so try the calculation yourself and check your own assumptions. The DCF also does not consider the possible cyclicality of an industry, or a company's future capital requirements, so it does not give a full picture of a company's potential performance. Given that we are looking at Rajratan Global Wire as potential shareholders, the cost of equity is used as the discount rate, rather than the cost of capital (or weighted average cost of capital, WACC) which accounts for debt. In this calculation we've used 15%, which is based on a levered beta of 1.153. Beta is a measure of a stock's volatility, compared to the market as a whole. We get our beta from the industry average beta of globally comparable companies, with an imposed limit between 0.8 and 2.0, which is a reasonable range for a stable business.
SWOT Analysis for Rajratan Global Wire
- Debt is well covered by earnings.
- Earnings declined over the past year.
- Dividend is low compared to the top 25% of dividend payers in the Metals and Mining market.
- Expensive based on P/E ratio and estimated fair value.
- Annual earnings are forecast to grow faster than the Indian market.
- Debt is not well covered by operating cash flow.
- Paying a dividend but company has no free cash flows.
- Revenue is forecast to grow slower than 20% per year.
Looking Ahead:
Whilst important, the DCF calculation shouldn't be the only metric you look at when researching a company. DCF models are not the be-all and end-all of investment valuation. Preferably you'd apply different cases and assumptions and see how they would impact the company's valuation. For example, changes in the company's cost of equity or the risk free rate can significantly impact the valuation. What is the reason for the share price exceeding the intrinsic value? For Rajratan Global Wire, we've put together three important elements you should assess:
- Risks: Every company has them, and we've spotted 2 warning signs for Rajratan Global Wire (of which 1 is a bit concerning!) you should know about.
- Future Earnings: How does RAJRATAN's growth rate compare to its peers and the wider market? Dig deeper into the analyst consensus number for the upcoming years by interacting with our free analyst growth expectation chart.
- Other High Quality Alternatives: Do you like a good all-rounder? Explore our interactive list of high quality stocks to get an idea of what else is out there you may be missing!
PS. The Simply Wall St app conducts a discounted cash flow valuation for every stock on the NSEI every day. If you want to find the calculation for other stocks just search here.
Mobile Infrastructure for Defense and Disaster
The next wave in robotics isn't humanoid. Its fully autonomous towers delivering 5G, ISR, and radar in under 30 minutes, anywhere.
Get the investor briefing before the next round of contracts
Sponsored On Behalf of CiTechNew: AI Stock Screener & Alerts
Our new AI Stock Screener scans the market every day to uncover opportunities.
• Dividend Powerhouses (3%+ Yield)
• Undervalued Small Caps with Insider Buying
• High growth Tech and AI Companies
Or build your own from over 50 metrics.
Have feedback on this article? Concerned about the content? Get in touch with us directly. Alternatively, email editorial-team (at) simplywallst.com.
This article by Simply Wall St is general in nature. We provide commentary based on historical data and analyst forecasts only using an unbiased methodology and our articles are not intended to be financial advice. It does not constitute a recommendation to buy or sell any stock, and does not take account of your objectives, or your financial situation. We aim to bring you long-term focused analysis driven by fundamental data. Note that our analysis may not factor in the latest price-sensitive company announcements or qualitative material. Simply Wall St has no position in any stocks mentioned.
About NSEI:RAJRATAN
Rajratan Global Wire
Engages in manufacturing and sale of tyre bead wires in India and Thailand.
Reasonable growth potential with adequate balance sheet and pays a dividend.
Similar Companies
Market Insights

Weekly Picks

THE KINGDOM OF BROWN GOODS: WHY MGPI IS BEING CRUSHED BY INVENTORY & PRIMED FOR RESURRECTION


Why Vertical Aerospace (NYSE: EVTL) is Worth Possibly Over 13x its Current Price


The Quiet Giant That Became AI’s Power Grid
Recently Updated Narratives


MINISO's fair value is projected at 26.69 with an anticipated PE ratio shift of 20x

Fiverr International will transform the freelance industry with AI-powered growth

Stride Stock: Online Education Finds Its Second Act
Popular Narratives


MicroVision will explode future revenue by 380.37% with a vision towards success


Crazy Undervalued 42 Baggers Silver Play (Active & Running Mine)


