

Some say volatility, rather than debt, is the best way to think about risk as an investor, but Warren Buffett famously said that 'Volatility is far from synonymous with risk.' So it might be obvious that you need to consider debt, when you think about how risky any given stock is, because too much debt can sink a company. Importantly, KIOCL Limited (NSE:KIOCL) does carry debt. But the more important question is: how much risk is that debt creating?
What Risk Does Debt Bring?
Generally speaking, debt only becomes a real problem when a company can't easily pay it off, either by raising capital or with its own cash flow. Part and parcel of capitalism is the process of 'creative destruction' where failed businesses are mercilessly liquidated by their bankers. However, a more frequent (but still costly) occurrence is where a company must issue shares at bargain-basement prices, permanently diluting shareholders, just to shore up its balance sheet. Having said that, the most common situation is where a company manages its debt reasonably well - and to its own advantage. When we examine debt levels, we first consider both cash and debt levels, together.
Check out our latest analysis for KIOCL
What Is KIOCL's Debt?
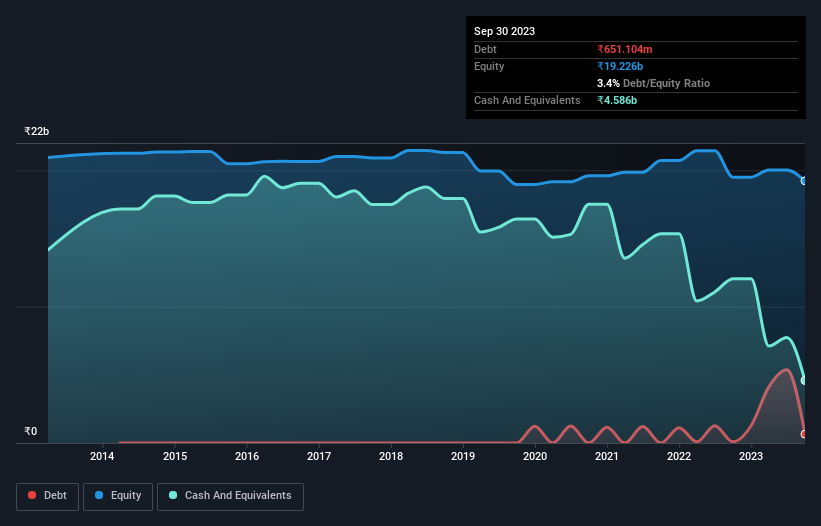
You can click the graphic below for the historical numbers, but it shows that as of September 2023 KIOCL had ₹651.1m of debt, an increase on ₹90.0m, over one year. But on the other hand it also has ₹4.59b in cash, leading to a ₹3.93b net cash position.
A Look At KIOCL's Liabilities
We can see from the most recent balance sheet that KIOCL had liabilities of ₹3.92b falling due within a year, and liabilities of ₹2.13b due beyond that. Offsetting this, it had ₹4.59b in cash and ₹2.08b in receivables that were due within 12 months. So it actually has ₹618.1m more liquid assets than total liabilities.
Having regard to KIOCL's size, it seems that its liquid assets are well balanced with its total liabilities. So it's very unlikely that the ₹227.9b company is short on cash, but still worth keeping an eye on the balance sheet. Succinctly put, KIOCL boasts net cash, so it's fair to say it does not have a heavy debt load! When analysing debt levels, the balance sheet is the obvious place to start. But it is KIOCL's earnings that will influence how the balance sheet holds up in the future. So when considering debt, it's definitely worth looking at the earnings trend. Click here for an interactive snapshot.
Over 12 months, KIOCL made a loss at the EBIT level, and saw its revenue drop to ₹20b, which is a fall of 3.4%. That's not what we would hope to see.
So How Risky Is KIOCL?
By their very nature companies that are losing money are more risky than those with a long history of profitability. And in the last year KIOCL had an earnings before interest and tax (EBIT) loss, truth be told. And over the same period it saw negative free cash outflow of ₹8.3b and booked a ₹311m accounting loss. Given it only has net cash of ₹3.93b, the company may need to raise more capital if it doesn't reach break-even soon. Even though its balance sheet seems sufficiently liquid, debt always makes us a little nervous if a company doesn't produce free cash flow regularly. The balance sheet is clearly the area to focus on when you are analysing debt. However, not all investment risk resides within the balance sheet - far from it. For example, we've discovered 2 warning signs for KIOCL that you should be aware of before investing here.
If, after all that, you're more interested in a fast growing company with a rock-solid balance sheet, then check out our list of net cash growth stocks without delay.
Valuation is complex, but we're here to simplify it.
Discover if KIOCL might be undervalued or overvalued with our detailed analysis, featuring fair value estimates, potential risks, dividends, insider trades, and its financial condition.
Access Free AnalysisHave feedback on this article? Concerned about the content? Get in touch with us directly. Alternatively, email editorial-team (at) simplywallst.com.
This article by Simply Wall St is general in nature. We provide commentary based on historical data and analyst forecasts only using an unbiased methodology and our articles are not intended to be financial advice. It does not constitute a recommendation to buy or sell any stock, and does not take account of your objectives, or your financial situation. We aim to bring you long-term focused analysis driven by fundamental data. Note that our analysis may not factor in the latest price-sensitive company announcements or qualitative material. Simply Wall St has no position in any stocks mentioned.
About NSEI:KIOCL
KIOCL
Engages in the iron ore mining, beneficiation, and production of pellets in India and internationally.
Adequate balance sheet minimal.
Similar Companies
Market Insights

Community Narratives
