- India
- /
- Healthcare Services
- /
- NSEI:REMUS
Here's What Remus Pharmaceuticals' (NSE:REMUS) Strong Returns On Capital Mean


If you're not sure where to start when looking for the next multi-bagger, there are a few key trends you should keep an eye out for. Typically, we'll want to notice a trend of growing return on capital employed (ROCE) and alongside that, an expanding base of capital employed. Put simply, these types of businesses are compounding machines, meaning they are continually reinvesting their earnings at ever-higher rates of return. So, when we ran our eye over Remus Pharmaceuticals' (NSE:REMUS) trend of ROCE, we really liked what we saw.
Understanding Return On Capital Employed (ROCE)
Just to clarify if you're unsure, ROCE is a metric for evaluating how much pre-tax income (in percentage terms) a company earns on the capital invested in its business. Analysts use this formula to calculate it for Remus Pharmaceuticals:
Return on Capital Employed = Earnings Before Interest and Tax (EBIT) ÷ (Total Assets - Current Liabilities)
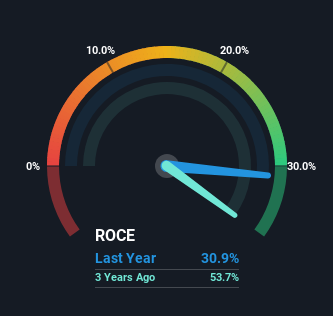
0.31 = ₹392m ÷ (₹2.2b - ₹944m) (Based on the trailing twelve months to September 2024).
So, Remus Pharmaceuticals has an ROCE of 31%. In absolute terms that's a great return and it's even better than the Healthcare industry average of 14%.
See our latest analysis for Remus Pharmaceuticals
While the past is not representative of the future, it can be helpful to know how a company has performed historically, which is why we have this chart above. If you'd like to look at how Remus Pharmaceuticals has performed in the past in other metrics, you can view this free graph of Remus Pharmaceuticals' past earnings, revenue and cash flow.
What Does the ROCE Trend For Remus Pharmaceuticals Tell Us?
Remus Pharmaceuticals deserves to be commended in regards to it's returns. The company has employed 4,327% more capital in the last four years, and the returns on that capital have remained stable at 31%. With returns that high, it's great that the business can continually reinvest its money at such appealing rates of return. You'll see this when looking at well operated businesses or favorable business models.
One more thing to note, even though ROCE has remained relatively flat over the last four years, the reduction in current liabilities to 43% of total assets, is good to see from a business owner's perspective. Effectively suppliers now fund less of the business, which can lower some elements of risk. Although because current liabilities are still 43%, some of that risk is still prevalent.
What We Can Learn From Remus Pharmaceuticals' ROCE
In summary, we're delighted to see that Remus Pharmaceuticals has been compounding returns by reinvesting at consistently high rates of return, as these are common traits of a multi-bagger. Therefore it's no surprise that shareholders have earned a respectable 55% return if they held over the last year. So while the positive underlying trends may be accounted for by investors, we still think this stock is worth looking into further.
On a separate note, we've found 2 warning signs for Remus Pharmaceuticals you'll probably want to know about.
If you'd like to see other companies earning high returns, check out our free list of companies earning high returns with solid balance sheets here.
If you're looking to trade Remus Pharmaceuticals, open an account with the lowest-cost platform trusted by professionals, Interactive Brokers.
With clients in over 200 countries and territories, and access to 160 markets, IBKR lets you trade stocks, options, futures, forex, bonds and funds from a single integrated account.
Enjoy no hidden fees, no account minimums, and FX conversion rates as low as 0.03%, far better than what most brokers offer.
Sponsored ContentNew: AI Stock Screener & Alerts
Our new AI Stock Screener scans the market every day to uncover opportunities.
• Dividend Powerhouses (3%+ Yield)
• Undervalued Small Caps with Insider Buying
• High growth Tech and AI Companies
Or build your own from over 50 metrics.
Have feedback on this article? Concerned about the content? Get in touch with us directly. Alternatively, email editorial-team (at) simplywallst.com.
This article by Simply Wall St is general in nature. We provide commentary based on historical data and analyst forecasts only using an unbiased methodology and our articles are not intended to be financial advice. It does not constitute a recommendation to buy or sell any stock, and does not take account of your objectives, or your financial situation. We aim to bring you long-term focused analysis driven by fundamental data. Note that our analysis may not factor in the latest price-sensitive company announcements or qualitative material. Simply Wall St has no position in any stocks mentioned.
About NSEI:REMUS
Remus Pharmaceuticals
Engages in the marketing, trading, and distribution of pharmaceutical finished formulations and products in India and internationally.
Solid track record with adequate balance sheet.
Similar Companies
Market Insights

Community Narratives


