
Advertisement
- India
- /
- Medical Equipment
- /
- NSEI:NURECA
Nureca Limited (NSE:NURECA) Shares May Have Slumped 26% But Getting In Cheap Is Still Unlikely

To the annoyance of some shareholders, Nureca Limited (NSE:NURECA) shares are down a considerable 26% in the last month, which continues a horrid run for the company. Instead of being rewarded, shareholders who have already held through the last twelve months are now sitting on a 15% share price drop.
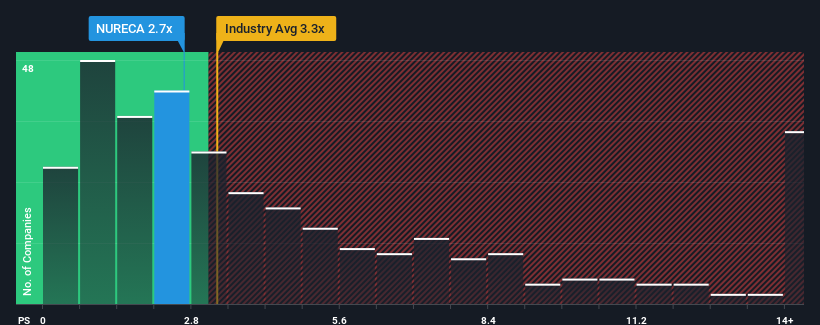
Although its price has dipped substantially, it's still not a stretch to say that Nureca's price-to-sales (or "P/S") ratio of 2.7x right now seems quite "middle-of-the-road" compared to the Medical Equipment industry in India, where the median P/S ratio is around 2.3x. However, investors might be overlooking a clear opportunity or potential setback if there is no rational basis for the P/S.
View our latest analysis for Nureca
What Does Nureca's P/S Mean For Shareholders?
As an illustration, revenue has deteriorated at Nureca over the last year, which is not ideal at all. Perhaps investors believe the recent revenue performance is enough to keep in line with the industry, which is keeping the P/S from dropping off. If not, then existing shareholders may be a little nervous about the viability of the share price.
Although there are no analyst estimates available for Nureca, take a look at this free data-rich visualisation to see how the company stacks up on earnings, revenue and cash flow.How Is Nureca's Revenue Growth Trending?
There's an inherent assumption that a company should be matching the industry for P/S ratios like Nureca's to be considered reasonable.
Retrospectively, the last year delivered a frustrating 27% decrease to the company's top line. The last three years don't look nice either as the company has shrunk revenue by 55% in aggregate. Therefore, it's fair to say the revenue growth recently has been undesirable for the company.
Weighing that medium-term revenue trajectory against the broader industry's one-year forecast for expansion of 20% shows it's an unpleasant look.
With this in mind, we find it worrying that Nureca's P/S exceeds that of its industry peers. It seems most investors are ignoring the recent poor growth rate and are hoping for a turnaround in the company's business prospects. Only the boldest would assume these prices are sustainable as a continuation of recent revenue trends is likely to weigh on the share price eventually.
What Does Nureca's P/S Mean For Investors?
With its share price dropping off a cliff, the P/S for Nureca looks to be in line with the rest of the Medical Equipment industry. Using the price-to-sales ratio alone to determine if you should sell your stock isn't sensible, however it can be a practical guide to the company's future prospects.
We find it unexpected that Nureca trades at a P/S ratio that is comparable to the rest of the industry, despite experiencing declining revenues during the medium-term, while the industry as a whole is expected to grow. When we see revenue heading backwards in the context of growing industry forecasts, it'd make sense to expect a possible share price decline on the horizon, sending the moderate P/S lower. Unless the recent medium-term conditions improve markedly, investors will have a hard time accepting the share price as fair value.
You should always think about risks. Case in point, we've spotted 3 warning signs for Nureca you should be aware of, and 1 of them is a bit concerning.
If you're unsure about the strength of Nureca's business, why not explore our interactive list of stocks with solid business fundamentals for some other companies you may have missed.
Valuation is complex, but we're here to simplify it.
Discover if Nureca might be undervalued or overvalued with our detailed analysis, featuring fair value estimates, potential risks, dividends, insider trades, and its financial condition.
Access Free AnalysisHave feedback on this article? Concerned about the content? Get in touch with us directly. Alternatively, email editorial-team (at) simplywallst.com.
This article by Simply Wall St is general in nature. We provide commentary based on historical data and analyst forecasts only using an unbiased methodology and our articles are not intended to be financial advice. It does not constitute a recommendation to buy or sell any stock, and does not take account of your objectives, or your financial situation. We aim to bring you long-term focused analysis driven by fundamental data. Note that our analysis may not factor in the latest price-sensitive company announcements or qualitative material. Simply Wall St has no position in any stocks mentioned.
About NSEI:NURECA
Excellent balance sheet and slightly overvalued.
Similar Companies
Market Insights

Advertisement
Community Narratives
RIO is poised to weather a depressed iron ore environment, but commodity diversification comes with lower margins
Fair Value AU$110.51|4.0% overvalued
DU
Community Contributor
The demand for personalized medicine will keep Thermo Fisher Scientific thriving
Fair Value US$540.27|21.0% undervalued
UN
Community Contributor
Silver Play by A Family with 10x Potential
Fair Value UK£24.00|88.8% undervalued
RO
Community Contributor