

Legendary fund manager Li Lu (who Charlie Munger backed) once said, 'The biggest investment risk is not the volatility of prices, but whether you will suffer a permanent loss of capital.' So it seems the smart money knows that debt - which is usually involved in bankruptcies - is a very important factor, when you assess how risky a company is. We can see that Oil India Limited (NSE:OIL) does use debt in its business. But the more important question is: how much risk is that debt creating?
What Risk Does Debt Bring?
Debt is a tool to help businesses grow, but if a business is incapable of paying off its lenders, then it exists at their mercy. If things get really bad, the lenders can take control of the business. However, a more common (but still painful) scenario is that it has to raise new equity capital at a low price, thus permanently diluting shareholders. Of course, the upside of debt is that it often represents cheap capital, especially when it replaces dilution in a company with the ability to reinvest at high rates of return. When we think about a company's use of debt, we first look at cash and debt together.
Check out our latest analysis for Oil India
What Is Oil India's Debt?
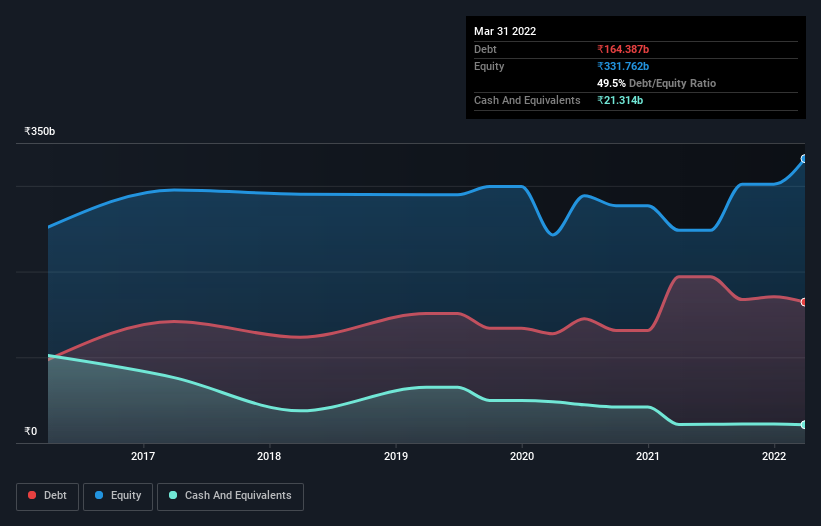
You can click the graphic below for the historical numbers, but it shows that Oil India had ₹164.4b of debt in March 2022, down from ₹194.1b, one year before. However, because it has a cash reserve of ₹21.3b, its net debt is less, at about ₹143.1b.
How Strong Is Oil India's Balance Sheet?
Zooming in on the latest balance sheet data, we can see that Oil India had liabilities of ₹68.1b due within 12 months and liabilities of ₹208.3b due beyond that. Offsetting this, it had ₹21.3b in cash and ₹21.0b in receivables that were due within 12 months. So its liabilities total ₹234.1b more than the combination of its cash and short-term receivables.
This is a mountain of leverage relative to its market capitalization of ₹258.6b. This suggests shareholders would be heavily diluted if the company needed to shore up its balance sheet in a hurry.
We use two main ratios to inform us about debt levels relative to earnings. The first is net debt divided by earnings before interest, tax, depreciation, and amortization (EBITDA), while the second is how many times its earnings before interest and tax (EBIT) covers its interest expense (or its interest cover, for short). The advantage of this approach is that we take into account both the absolute quantum of debt (with net debt to EBITDA) and the actual interest expenses associated with that debt (with its interest cover ratio).
Oil India has net debt of just 1.2 times EBITDA, suggesting it could ramp leverage without breaking a sweat. But the really cool thing is that it actually managed to receive more interest than it paid, over the last year. So it's fair to say it can handle debt like a hotshot teppanyaki chef handles cooking. Even more impressive was the fact that Oil India grew its EBIT by 127% over twelve months. If maintained that growth will make the debt even more manageable in the years ahead. There's no doubt that we learn most about debt from the balance sheet. But ultimately the future profitability of the business will decide if Oil India can strengthen its balance sheet over time. So if you're focused on the future you can check out this free report showing analyst profit forecasts.
But our final consideration is also important, because a company cannot pay debt with paper profits; it needs cold hard cash. So it's worth checking how much of that EBIT is backed by free cash flow. During the last three years, Oil India produced sturdy free cash flow equating to 52% of its EBIT, about what we'd expect. This cold hard cash means it can reduce its debt when it wants to.
Our View
Both Oil India's ability to to cover its interest expense with its EBIT and its EBIT growth rate gave us comfort that it can handle its debt. On the other hand, its level of total liabilities makes us a little less comfortable about its debt. When we consider all the elements mentioned above, it seems to us that Oil India is managing its debt quite well. Having said that, the load is sufficiently heavy that we would recommend any shareholders keep a close eye on it. The balance sheet is clearly the area to focus on when you are analysing debt. However, not all investment risk resides within the balance sheet - far from it. For example Oil India has 3 warning signs (and 1 which can't be ignored) we think you should know about.
If, after all that, you're more interested in a fast growing company with a rock-solid balance sheet, then check out our list of net cash growth stocks without delay.
New: AI Stock Screener & Alerts
Our new AI Stock Screener scans the market every day to uncover opportunities.
• Dividend Powerhouses (3%+ Yield)
• Undervalued Small Caps with Insider Buying
• High growth Tech and AI Companies
Or build your own from over 50 metrics.
Have feedback on this article? Concerned about the content? Get in touch with us directly. Alternatively, email editorial-team (at) simplywallst.com.
This article by Simply Wall St is general in nature. We provide commentary based on historical data and analyst forecasts only using an unbiased methodology and our articles are not intended to be financial advice. It does not constitute a recommendation to buy or sell any stock, and does not take account of your objectives, or your financial situation. We aim to bring you long-term focused analysis driven by fundamental data. Note that our analysis may not factor in the latest price-sensitive company announcements or qualitative material. Simply Wall St has no position in any stocks mentioned.
About NSEI:OIL
Oil India
Engages in the exploration, development, and production of crude oil and natural gas in India.
Solid track record, good value and pays a dividend.
Similar Companies
Market Insights

Community Narratives
