
Advertisement
- India
- /
- Capital Markets
- /
- NSEI:NAM-INDIA
Nippon Life India Asset Management (NSE:NAM-INDIA) sheds 5.9% this week, as yearly returns fall more in line with earnings growth

The most you can lose on any stock (assuming you don't use leverage) is 100% of your money. But on the bright side, you can make far more than 100% on a really good stock. For instance, the price of Nippon Life India Asset Management Limited (NSE:NAM-INDIA) stock is up an impressive 168% over the last five years. Unfortunately, though, the stock has dropped 5.9% over a week. This could be related to the recent financial results, released recently -- you can catch up on the most recent data by reading our company report.
Although Nippon Life India Asset Management has shed ₹25b from its market cap this week, let's take a look at its longer term fundamental trends and see if they've driven returns.
We've discovered 2 warning signs about Nippon Life India Asset Management. View them for free.There is no denying that markets are sometimes efficient, but prices do not always reflect underlying business performance. By comparing earnings per share (EPS) and share price changes over time, we can get a feel for how investor attitudes to a company have morphed over time.
Over half a decade, Nippon Life India Asset Management managed to grow its earnings per share at 24% a year. This EPS growth is reasonably close to the 22% average annual increase in the share price. Therefore one could conclude that sentiment towards the shares hasn't morphed very much. Rather, the share price has approximately tracked EPS growth.
The graphic below depicts how EPS has changed over time (unveil the exact values by clicking on the image).
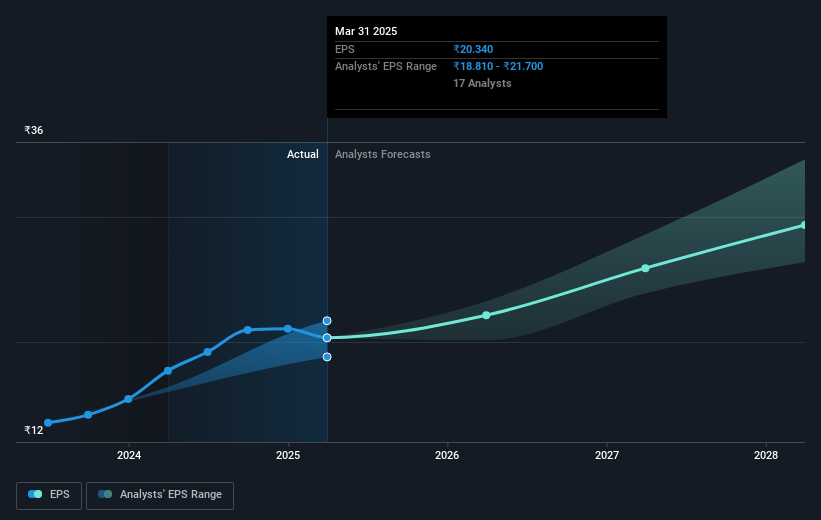
We know that Nippon Life India Asset Management has improved its bottom line lately, but is it going to grow revenue? You could check out this free report showing analyst revenue forecasts.
What About Dividends?
As well as measuring the share price return, investors should also consider the total shareholder return (TSR). Whereas the share price return only reflects the change in the share price, the TSR includes the value of dividends (assuming they were reinvested) and the benefit of any discounted capital raising or spin-off. It's fair to say that the TSR gives a more complete picture for stocks that pay a dividend. In the case of Nippon Life India Asset Management, it has a TSR of 212% for the last 5 years. That exceeds its share price return that we previously mentioned. The dividends paid by the company have thusly boosted the total shareholder return.
A Different Perspective
We're pleased to report that Nippon Life India Asset Management shareholders have received a total shareholder return of 8.8% over one year. That's including the dividend. However, that falls short of the 26% TSR per annum it has made for shareholders, each year, over five years. Potential buyers might understandably feel they've missed the opportunity, but it's always possible business is still firing on all cylinders. It's always interesting to track share price performance over the longer term. But to understand Nippon Life India Asset Management better, we need to consider many other factors. Even so, be aware that Nippon Life India Asset Management is showing 2 warning signs in our investment analysis , you should know about...
If you are like me, then you will not want to miss this free list of undervalued small caps that insiders are buying.
Please note, the market returns quoted in this article reflect the market weighted average returns of stocks that currently trade on Indian exchanges.
Valuation is complex, but we're here to simplify it.
Discover if Nippon Life India Asset Management might be undervalued or overvalued with our detailed analysis, featuring fair value estimates, potential risks, dividends, insider trades, and its financial condition.
Access Free AnalysisHave feedback on this article? Concerned about the content? Get in touch with us directly. Alternatively, email editorial-team (at) simplywallst.com.
This article by Simply Wall St is general in nature. We provide commentary based on historical data and analyst forecasts only using an unbiased methodology and our articles are not intended to be financial advice. It does not constitute a recommendation to buy or sell any stock, and does not take account of your objectives, or your financial situation. We aim to bring you long-term focused analysis driven by fundamental data. Note that our analysis may not factor in the latest price-sensitive company announcements or qualitative material. Simply Wall St has no position in any stocks mentioned.
About NSEI:NAM-INDIA
Nippon Life India Asset Management
Nippon Life Asset Management Limited is a publicly owned investment manager.
Excellent balance sheet with moderate growth potential.
Similar Companies
Market Insights

Advertisement
Community Narratives
Pinterest will surge as advertising innovations ignite revenue growth
Fair Value US$42.63|26.1% undervalued
BR
Community Contributor
Brambles' Revenue Set to Climb 14% with Profit Margins Following
Fair Value AU$21.90|4.8% overvalued
RO
Community Contributor
Challenging Future for STG as Organic Sales Decline by 8.8%
Fair Value DKK 116.13|27.0% undervalued
KA
Community Contributor