Pioneer Embroideries Limited (NSE:PIONEEREMB) Stock's 25% Dive Might Signal An Opportunity But It Requires Some Scrutiny


The Pioneer Embroideries Limited (NSE:PIONEEREMB) share price has fared very poorly over the last month, falling by a substantial 25%. Still, a bad month hasn't completely ruined the past year with the stock gaining 42%, which is great even in a bull market.
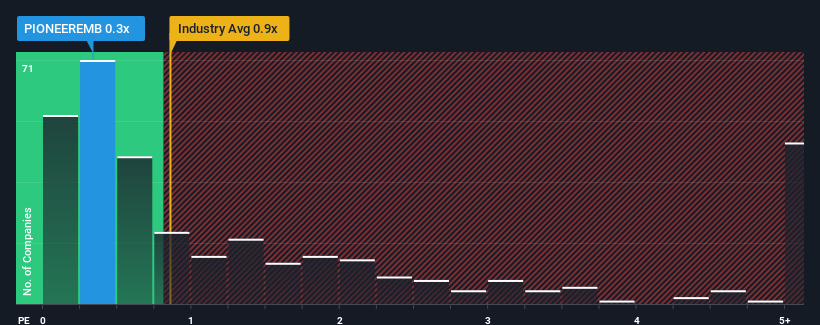
In spite of the heavy fall in price, Pioneer Embroideries' price-to-sales (or "P/S") ratio of 0.3x might still make it look like a buy right now compared to the Luxury industry in India, where around half of the companies have P/S ratios above 0.9x and even P/S above 3x are quite common. However, the P/S might be low for a reason and it requires further investigation to determine if it's justified.
View our latest analysis for Pioneer Embroideries
What Does Pioneer Embroideries' Recent Performance Look Like?
Pioneer Embroideries has been doing a decent job lately as it's been growing revenue at a reasonable pace. Perhaps the market believes the recent revenue performance might fall short of industry figures in the near future, leading to a reduced P/S. If you like the company, you'd be hoping this isn't the case so that you could potentially pick up some stock while it's out of favour.
Want the full picture on earnings, revenue and cash flow for the company? Then our free report on Pioneer Embroideries will help you shine a light on its historical performance.How Is Pioneer Embroideries' Revenue Growth Trending?
There's an inherent assumption that a company should underperform the industry for P/S ratios like Pioneer Embroideries' to be considered reasonable.
Taking a look back first, we see that the company managed to grow revenues by a handy 6.5% last year. Pleasingly, revenue has also lifted 60% in aggregate from three years ago, partly thanks to the last 12 months of growth. Accordingly, shareholders would have definitely welcomed those medium-term rates of revenue growth.
When compared to the industry's one-year growth forecast of 12%, the most recent medium-term revenue trajectory is noticeably more alluring
With this in mind, we find it intriguing that Pioneer Embroideries' P/S isn't as high compared to that of its industry peers. Apparently some shareholders believe the recent performance has exceeded its limits and have been accepting significantly lower selling prices.
What We Can Learn From Pioneer Embroideries' P/S?
Pioneer Embroideries' recently weak share price has pulled its P/S back below other Luxury companies. While the price-to-sales ratio shouldn't be the defining factor in whether you buy a stock or not, it's quite a capable barometer of revenue expectations.
We're very surprised to see Pioneer Embroideries currently trading on a much lower than expected P/S since its recent three-year growth is higher than the wider industry forecast. Potential investors that are sceptical over continued revenue performance may be preventing the P/S ratio from matching previous strong performance. It appears many are indeed anticipating revenue instability, because the persistence of these recent medium-term conditions would normally provide a boost to the share price.
Having said that, be aware Pioneer Embroideries is showing 4 warning signs in our investment analysis, and 1 of those can't be ignored.
If strong companies turning a profit tickle your fancy, then you'll want to check out this free list of interesting companies that trade on a low P/E (but have proven they can grow earnings).
New: Manage All Your Stock Portfolios in One Place
We've created the ultimate portfolio companion for stock investors, and it's free.
• Connect an unlimited number of Portfolios and see your total in one currency
• Be alerted to new Warning Signs or Risks via email or mobile
• Track the Fair Value of your stocks
Have feedback on this article? Concerned about the content? Get in touch with us directly. Alternatively, email editorial-team (at) simplywallst.com.
This article by Simply Wall St is general in nature. We provide commentary based on historical data and analyst forecasts only using an unbiased methodology and our articles are not intended to be financial advice. It does not constitute a recommendation to buy or sell any stock, and does not take account of your objectives, or your financial situation. We aim to bring you long-term focused analysis driven by fundamental data. Note that our analysis may not factor in the latest price-sensitive company announcements or qualitative material. Simply Wall St has no position in any stocks mentioned.
About NSEI:PIONEEREMB
Pioneer Embroideries
Engages in the manufacture of special polyester filament yarn, embroidery, and lace products in India.
Proven track record with mediocre balance sheet.
Similar Companies
Market Insights

Community Narratives
