Loyal Textile Mills Limited's (NSE:LOYALTEX) 25% Dip In Price Shows Sentiment Is Matching Revenues

Loyal Textile Mills Limited (NSE:LOYALTEX) shareholders that were waiting for something to happen have been dealt a blow with a 25% share price drop in the last month. The drop over the last 30 days has capped off a tough year for shareholders, with the share price down 29% in that time.
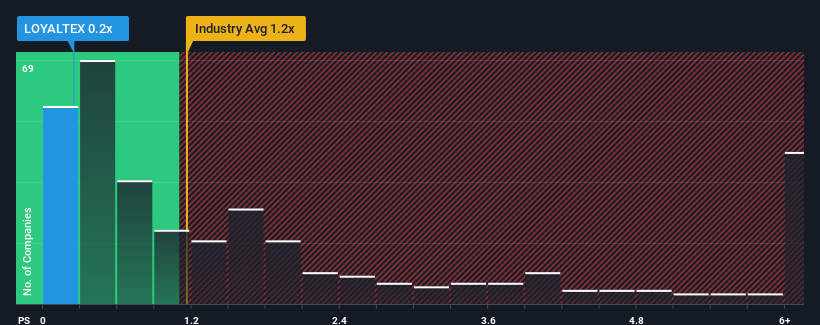
Following the heavy fall in price, considering around half the companies operating in India's Luxury industry have price-to-sales ratios (or "P/S") above 1.2x, you may consider Loyal Textile Mills as an solid investment opportunity with its 0.2x P/S ratio. Although, it's not wise to just take the P/S at face value as there may be an explanation why it's limited.
Check out our latest analysis for Loyal Textile Mills

How Loyal Textile Mills Has Been Performing
For example, consider that Loyal Textile Mills' financial performance has been poor lately as its revenue has been in decline. Perhaps the market believes the recent revenue performance isn't good enough to keep up the industry, causing the P/S ratio to suffer. Those who are bullish on Loyal Textile Mills will be hoping that this isn't the case so that they can pick up the stock at a lower valuation.
Want the full picture on earnings, revenue and cash flow for the company? Then our free report on Loyal Textile Mills will help you shine a light on its historical performance.Do Revenue Forecasts Match The Low P/S Ratio?
Loyal Textile Mills' P/S ratio would be typical for a company that's only expected to deliver limited growth, and importantly, perform worse than the industry.
In reviewing the last year of financials, we were disheartened to see the company's revenues fell to the tune of 32%. This means it has also seen a slide in revenue over the longer-term as revenue is down 35% in total over the last three years. Accordingly, shareholders would have felt downbeat about the medium-term rates of revenue growth.
In contrast to the company, the rest of the industry is expected to grow by 25% over the next year, which really puts the company's recent medium-term revenue decline into perspective.
In light of this, it's understandable that Loyal Textile Mills' P/S would sit below the majority of other companies. Nonetheless, there's no guarantee the P/S has reached a floor yet with revenue going in reverse. Even just maintaining these prices could be difficult to achieve as recent revenue trends are already weighing down the shares.
What We Can Learn From Loyal Textile Mills' P/S?
Loyal Textile Mills' recently weak share price has pulled its P/S back below other Luxury companies. It's argued the price-to-sales ratio is an inferior measure of value within certain industries, but it can be a powerful business sentiment indicator.
As we suspected, our examination of Loyal Textile Mills revealed its shrinking revenue over the medium-term is contributing to its low P/S, given the industry is set to grow. Right now shareholders are accepting the low P/S as they concede future revenue probably won't provide any pleasant surprises either. Unless the recent medium-term conditions improve, they will continue to form a barrier for the share price around these levels.
And what about other risks? Every company has them, and we've spotted 4 warning signs for Loyal Textile Mills (of which 2 are concerning!) you should know about.
It's important to make sure you look for a great company, not just the first idea you come across. So if growing profitability aligns with your idea of a great company, take a peek at this free list of interesting companies with strong recent earnings growth (and a low P/E).
If you're looking to trade Loyal Textile Mills, open an account with the lowest-cost platform trusted by professionals, Interactive Brokers.
With clients in over 200 countries and territories, and access to 160 markets, IBKR lets you trade stocks, options, futures, forex, bonds and funds from a single integrated account.
Enjoy no hidden fees, no account minimums, and FX conversion rates as low as 0.03%, far better than what most brokers offer.
Sponsored ContentNew: AI Stock Screener & Alerts
Our new AI Stock Screener scans the market every day to uncover opportunities.
• Dividend Powerhouses (3%+ Yield)
• Undervalued Small Caps with Insider Buying
• High growth Tech and AI Companies
Or build your own from over 50 metrics.
Have feedback on this article? Concerned about the content? Get in touch with us directly. Alternatively, email editorial-team (at) simplywallst.com.
This article by Simply Wall St is general in nature. We provide commentary based on historical data and analyst forecasts only using an unbiased methodology and our articles are not intended to be financial advice. It does not constitute a recommendation to buy or sell any stock, and does not take account of your objectives, or your financial situation. We aim to bring you long-term focused analysis driven by fundamental data. Note that our analysis may not factor in the latest price-sensitive company announcements or qualitative material. Simply Wall St has no position in any stocks mentioned.
About NSEI:LOYALTEX
Loyal Textile Mills
Manufactures and sells yarn, woven fabric, knitted fabric, and technical clothing products for the textile and apparel industries in India.
Good value low.
Market Insights
Community Narratives


