- India
- /
- Construction
- /
- NSEI:IRB
IRB Infrastructure Developers (NSE:IRB) sheds 7.8% this week, as yearly returns fall more in line with earnings growth


IRB Infrastructure Developers Limited (NSE:IRB) shareholders might be concerned after seeing the share price drop 13% in the last month. But that does not change the realty that the stock's performance has been terrific, over five years. To be precise, the stock price is 411% higher than it was five years ago, a wonderful performance by any measure. So it might be that some shareholders are taking profits after good performance. But the real question is whether the business fundamentals can improve over the long term. Unfortunately not all shareholders will have held it for the long term, so spare a thought for those caught in the 28% decline over the last twelve months.
In light of the stock dropping 7.8% in the past week, we want to investigate the longer term story, and see if fundamentals have been the driver of the company's positive five-year return.
Check out our latest analysis for IRB Infrastructure Developers
While markets are a powerful pricing mechanism, share prices reflect investor sentiment, not just underlying business performance. One way to examine how market sentiment has changed over time is to look at the interaction between a company's share price and its earnings per share (EPS).
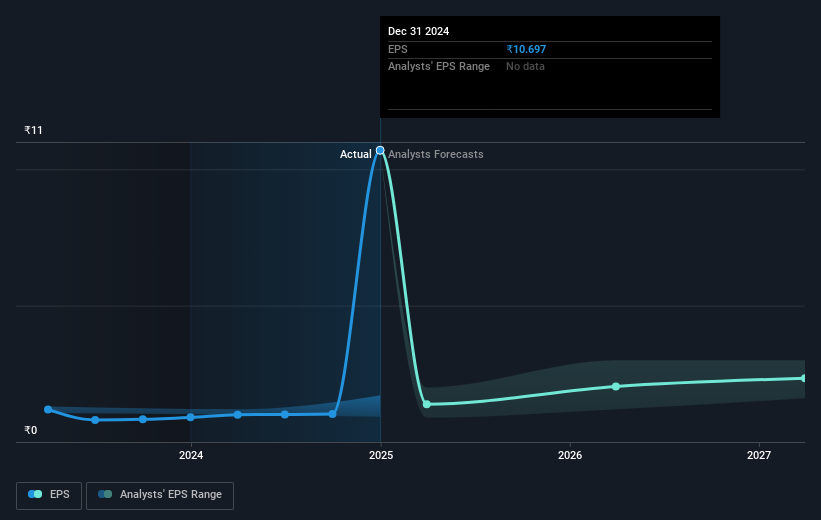
During five years of share price growth, IRB Infrastructure Developers achieved compound earnings per share (EPS) growth of 37% per year. That makes the EPS growth particularly close to the yearly share price growth of 39%. This indicates that investor sentiment towards the company has not changed a great deal. Indeed, it would appear the share price is reacting to the EPS.
The graphic below depicts how EPS has changed over time (unveil the exact values by clicking on the image).
It is of course excellent to see how IRB Infrastructure Developers has grown profits over the years, but the future is more important for shareholders. It might be well worthwhile taking a look at our free report on how its financial position has changed over time.
What About Dividends?
It is important to consider the total shareholder return, as well as the share price return, for any given stock. Whereas the share price return only reflects the change in the share price, the TSR includes the value of dividends (assuming they were reinvested) and the benefit of any discounted capital raising or spin-off. So for companies that pay a generous dividend, the TSR is often a lot higher than the share price return. We note that for IRB Infrastructure Developers the TSR over the last 5 years was 444%, which is better than the share price return mentioned above. The dividends paid by the company have thusly boosted the total shareholder return.
A Different Perspective
While the broader market lost about 0.1% in the twelve months, IRB Infrastructure Developers shareholders did even worse, losing 28% (even including dividends). However, it could simply be that the share price has been impacted by broader market jitters. It might be worth keeping an eye on the fundamentals, in case there's a good opportunity. On the bright side, long term shareholders have made money, with a gain of 40% per year over half a decade. If the fundamental data continues to indicate long term sustainable growth, the current sell-off could be an opportunity worth considering. I find it very interesting to look at share price over the long term as a proxy for business performance. But to truly gain insight, we need to consider other information, too. Like risks, for instance. Every company has them, and we've spotted 4 warning signs for IRB Infrastructure Developers (of which 2 are concerning!) you should know about.
We will like IRB Infrastructure Developers better if we see some big insider buys. While we wait, check out this free list of undervalued stocks (mostly small caps) with considerable, recent, insider buying.
Please note, the market returns quoted in this article reflect the market weighted average returns of stocks that currently trade on Indian exchanges.
New: AI Stock Screener & Alerts
Our new AI Stock Screener scans the market every day to uncover opportunities.
• Dividend Powerhouses (3%+ Yield)
• Undervalued Small Caps with Insider Buying
• High growth Tech and AI Companies
Or build your own from over 50 metrics.
Have feedback on this article? Concerned about the content? Get in touch with us directly. Alternatively, email editorial-team (at) simplywallst.com.
This article by Simply Wall St is general in nature. We provide commentary based on historical data and analyst forecasts only using an unbiased methodology and our articles are not intended to be financial advice. It does not constitute a recommendation to buy or sell any stock, and does not take account of your objectives, or your financial situation. We aim to bring you long-term focused analysis driven by fundamental data. Note that our analysis may not factor in the latest price-sensitive company announcements or qualitative material. Simply Wall St has no position in any stocks mentioned.
About NSEI:IRB
IRB Infrastructure Developers
Engages in the infrastructure development business in India.
Very undervalued with proven track record.
Similar Companies
Market Insights

Community Narratives

