

What trends should we look for it we want to identify stocks that can multiply in value over the long term? In a perfect world, we'd like to see a company investing more capital into its business and ideally the returns earned from that capital are also increasing. Ultimately, this demonstrates that it's a business that is reinvesting profits at increasing rates of return. However, after briefly looking over the numbers, we don't think HPL Electric & Power (NSE:HPL) has the makings of a multi-bagger going forward, but let's have a look at why that may be.
What is Return On Capital Employed (ROCE)?
Just to clarify if you're unsure, ROCE is a metric for evaluating how much pre-tax income (in percentage terms) a company earns on the capital invested in its business. To calculate this metric for HPL Electric & Power, this is the formula:
Return on Capital Employed = Earnings Before Interest and Tax (EBIT) ÷ (Total Assets - Current Liabilities)
0.073 = ₹606m ÷ (₹16b - ₹7.4b) (Based on the trailing twelve months to September 2020).
So, HPL Electric & Power has an ROCE of 7.3%. In absolute terms, that's a low return and it also under-performs the Electrical industry average of 9.8%.
View our latest analysis for HPL Electric & Power
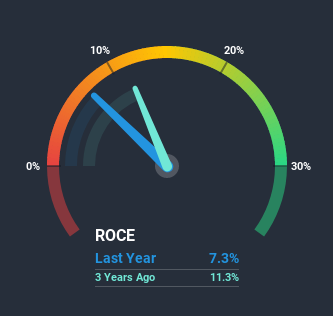
While the past is not representative of the future, it can be helpful to know how a company has performed historically, which is why we have this chart above. If you want to delve into the historical earnings, revenue and cash flow of HPL Electric & Power, check out these free graphs here.
What The Trend Of ROCE Can Tell Us
On the surface, the trend of ROCE at HPL Electric & Power doesn't inspire confidence. To be more specific, ROCE has fallen from 24% over the last five years. Given the business is employing more capital while revenue has slipped, this is a bit concerning. This could mean that the business is losing its competitive advantage or market share, because while more money is being put into ventures, it's actually producing a lower return - "less bang for their buck" per se.
On a related note, HPL Electric & Power has decreased its current liabilities to 47% of total assets. That could partly explain why the ROCE has dropped. What's more, this can reduce some aspects of risk to the business because now the company's suppliers or short-term creditors are funding less of its operations. Some would claim this reduces the business' efficiency at generating ROCE since it is now funding more of the operations with its own money. Keep in mind 47% is still pretty high, so those risks are still somewhat prevalent.Our Take On HPL Electric & Power's ROCE
From the above analysis, we find it rather worrisome that returns on capital and sales for HPL Electric & Power have fallen, meanwhile the business is employing more capital than it was five years ago. This could explain why the stock has sunk a total of 72% in the last three years. With underlying trends that aren't great in these areas, we'd consider looking elsewhere.
One more thing: We've identified 3 warning signs with HPL Electric & Power (at least 2 which are a bit concerning) , and understanding these would certainly be useful.
If you want to search for solid companies with great earnings, check out this free list of companies with good balance sheets and impressive returns on equity.
When trading HPL Electric & Power or any other investment, use the platform considered by many to be the Professional's Gateway to the Worlds Market, Interactive Brokers. You get the lowest-cost* trading on stocks, options, futures, forex, bonds and funds worldwide from a single integrated account. Promoted
Valuation is complex, but we're here to simplify it.
Discover if HPL Electric & Power might be undervalued or overvalued with our detailed analysis, featuring fair value estimates, potential risks, dividends, insider trades, and its financial condition.
Access Free AnalysisThis article by Simply Wall St is general in nature. It does not constitute a recommendation to buy or sell any stock, and does not take account of your objectives, or your financial situation. We aim to bring you long-term focused analysis driven by fundamental data. Note that our analysis may not factor in the latest price-sensitive company announcements or qualitative material. Simply Wall St has no position in any stocks mentioned.
*Interactive Brokers Rated Lowest Cost Broker by StockBrokers.com Annual Online Review 2020
Have feedback on this article? Concerned about the content? Get in touch with us directly. Alternatively, email editorial-team@simplywallst.com.
About NSEI:HPL
HPL Electric & Power
Manufactures and sells electric equipment under the HPL brand in India.
High growth potential with solid track record.
Market Insights

Community Narratives

