
Advertisement
Returns On Capital Signal Tricky Times Ahead For Confidence Petroleum India (NSE:CONFIPET)

If we want to find a potential multi-bagger, often there are underlying trends that can provide clues. Firstly, we'd want to identify a growing return on capital employed (ROCE) and then alongside that, an ever-increasing base of capital employed. This shows us that it's a compounding machine, able to continually reinvest its earnings back into the business and generate higher returns. However, after investigating Confidence Petroleum India (NSE:CONFIPET), we don't think it's current trends fit the mold of a multi-bagger.
We've discovered 2 warning signs about Confidence Petroleum India. View them for free.What Is Return On Capital Employed (ROCE)?
For those that aren't sure what ROCE is, it measures the amount of pre-tax profits a company can generate from the capital employed in its business. Analysts use this formula to calculate it for Confidence Petroleum India:
Return on Capital Employed = Earnings Before Interest and Tax (EBIT) ÷ (Total Assets - Current Liabilities)
0.077 = ₹1.5b ÷ (₹25b - ₹5.9b) (Based on the trailing twelve months to December 2024).
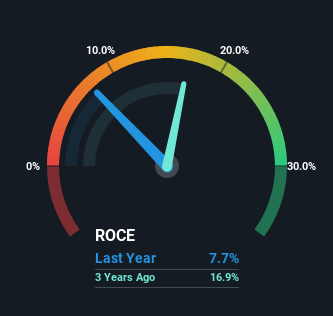
So, Confidence Petroleum India has an ROCE of 7.7%. Ultimately, that's a low return and it under-performs the Machinery industry average of 16%.
Check out our latest analysis for Confidence Petroleum India
While the past is not representative of the future, it can be helpful to know how a company has performed historically, which is why we have this chart above. If you're interested in investigating Confidence Petroleum India's past further, check out this free graph covering Confidence Petroleum India's past earnings, revenue and cash flow.
So How Is Confidence Petroleum India's ROCE Trending?
In terms of Confidence Petroleum India's historical ROCE movements, the trend isn't fantastic. Around five years ago the returns on capital were 15%, but since then they've fallen to 7.7%. Meanwhile, the business is utilizing more capital but this hasn't moved the needle much in terms of sales in the past 12 months, so this could reflect longer term investments. It may take some time before the company starts to see any change in earnings from these investments.
While on the subject, we noticed that the ratio of current liabilities to total assets has risen to 24%, which has impacted the ROCE. If current liabilities hadn't increased as much as they did, the ROCE could actually be even lower. While the ratio isn't currently too high, it's worth keeping an eye on this because if it gets particularly high, the business could then face some new elements of risk.
The Key Takeaway
To conclude, we've found that Confidence Petroleum India is reinvesting in the business, but returns have been falling. Investors must think there's better things to come because the stock has knocked it out of the park, delivering a 223% gain to shareholders who have held over the last five years. But if the trajectory of these underlying trends continue, we think the likelihood of it being a multi-bagger from here isn't high.
If you'd like to know more about Confidence Petroleum India, we've spotted 2 warning signs, and 1 of them is a bit unpleasant.
For those who like to invest in solid companies, check out this free list of companies with solid balance sheets and high returns on equity.
New: AI Stock Screener & Alerts
Our new AI Stock Screener scans the market every day to uncover opportunities.
• Dividend Powerhouses (3%+ Yield)
• Undervalued Small Caps with Insider Buying
• High growth Tech and AI Companies
Or build your own from over 50 metrics.
Have feedback on this article? Concerned about the content? Get in touch with us directly. Alternatively, email editorial-team (at) simplywallst.com.
This article by Simply Wall St is general in nature. We provide commentary based on historical data and analyst forecasts only using an unbiased methodology and our articles are not intended to be financial advice. It does not constitute a recommendation to buy or sell any stock, and does not take account of your objectives, or your financial situation. We aim to bring you long-term focused analysis driven by fundamental data. Note that our analysis may not factor in the latest price-sensitive company announcements or qualitative material. Simply Wall St has no position in any stocks mentioned.
About NSEI:CONFIPET
Confidence Petroleum India
Engages in the manufacture and sale of liquefied petroleum gas (LPG) cylinders in India.
Slightly overvalued with questionable track record.
Similar Companies
Market Insights

Advertisement
Community Narratives

Apple: A Dying Star with an Overpriced Valuation
Fair Value US$177.34|19.1% overvalued
IN
Community Contributor
Avino a case for USD$20 per share within 5 years (assuming $3,500 gold, $100 silver and $4 copper).
Fair Value CA$26.79|86.0% undervalued
AG
Community Contributor
Riding the Defense Boom RENK Sees Revenue Climb at 15% CAGR by FY 2029
Fair Value €69.87|14.3% undervalued
CH
Community Contributor