- India
- /
- Auto Components
- /
- NSEI:CEATLTD
CEAT's (NSE:CEATLTD) 24% CAGR outpaced the company's earnings growth over the same five-year period


When you buy a stock there is always a possibility that it could drop 100%. But on the bright side, if you buy shares in a high quality company at the right price, you can gain well over 100%. One great example is CEAT Limited (NSE:CEATLTD) which saw its share price drive 178% higher over five years. In more good news, the share price has risen 8.7% in thirty days. But the price may well have benefitted from a buoyant market, since stocks have gained 3.9% in the last thirty days.
On the back of a solid 7-day performance, let's check what role the company's fundamentals have played in driving long term shareholder returns.
View our latest analysis for CEAT
There is no denying that markets are sometimes efficient, but prices do not always reflect underlying business performance. One imperfect but simple way to consider how the market perception of a company has shifted is to compare the change in the earnings per share (EPS) with the share price movement.
Over half a decade, CEAT managed to grow its earnings per share at 21% a year. This EPS growth is reasonably close to the 23% average annual increase in the share price. This indicates that investor sentiment towards the company has not changed a great deal. In fact, the share price seems to largely reflect the EPS growth.
The graphic below depicts how EPS has changed over time (unveil the exact values by clicking on the image).
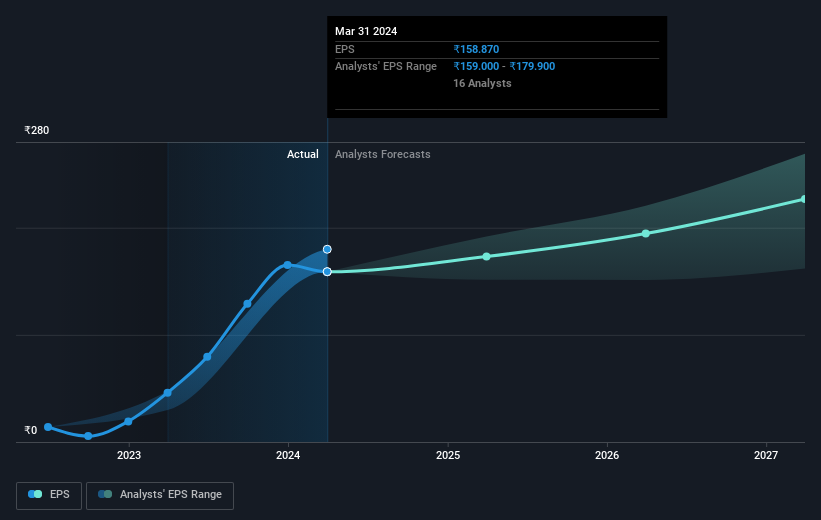
We know that CEAT has improved its bottom line lately, but is it going to grow revenue? You could check out this free report showing analyst revenue forecasts.
What About Dividends?
As well as measuring the share price return, investors should also consider the total shareholder return (TSR). The TSR is a return calculation that accounts for the value of cash dividends (assuming that any dividend received was reinvested) and the calculated value of any discounted capital raisings and spin-offs. Arguably, the TSR gives a more comprehensive picture of the return generated by a stock. We note that for CEAT the TSR over the last 5 years was 193%, which is better than the share price return mentioned above. This is largely a result of its dividend payments!
A Different Perspective
CEAT shareholders gained a total return of 25% during the year. Unfortunately this falls short of the market return. On the bright side, that's still a gain, and it's actually better than the average return of 24% over half a decade It is possible that returns will improve along with the business fundamentals. I find it very interesting to look at share price over the long term as a proxy for business performance. But to truly gain insight, we need to consider other information, too. For instance, we've identified 1 warning sign for CEAT that you should be aware of.
If you are like me, then you will not want to miss this free list of undervalued small caps that insiders are buying.
Please note, the market returns quoted in this article reflect the market weighted average returns of stocks that currently trade on Indian exchanges.
New: AI Stock Screener & Alerts
Our new AI Stock Screener scans the market every day to uncover opportunities.
• Dividend Powerhouses (3%+ Yield)
• Undervalued Small Caps with Insider Buying
• High growth Tech and AI Companies
Or build your own from over 50 metrics.
Have feedback on this article? Concerned about the content? Get in touch with us directly. Alternatively, email editorial-team (at) simplywallst.com.
This article by Simply Wall St is general in nature. We provide commentary based on historical data and analyst forecasts only using an unbiased methodology and our articles are not intended to be financial advice. It does not constitute a recommendation to buy or sell any stock, and does not take account of your objectives, or your financial situation. We aim to bring you long-term focused analysis driven by fundamental data. Note that our analysis may not factor in the latest price-sensitive company announcements or qualitative material. Simply Wall St has no position in any stocks mentioned.
Have feedback on this article? Concerned about the content? Get in touch with us directly. Alternatively, email editorial-team@simplywallst.com
About NSEI:CEATLTD
CEAT
Manufactures and sells automotive tyres, tubes, and flaps in India and internationally.
Adequate balance sheet average dividend payer.
Similar Companies
Market Insights

Community Narratives

