- Israel
- /
- Metals and Mining
- /
- TASE:GAGR
Returns On Capital Are Showing Encouraging Signs At Gaon Group (TLV:GAGR)

If we want to find a stock that could multiply over the long term, what are the underlying trends we should look for? Typically, we'll want to notice a trend of growing return on capital employed (ROCE) and alongside that, an expanding base of capital employed. Basically this means that a company has profitable initiatives that it can continue to reinvest in, which is a trait of a compounding machine. So on that note, Gaon Group (TLV:GAGR) looks quite promising in regards to its trends of return on capital.
Understanding Return On Capital Employed (ROCE)
If you haven't worked with ROCE before, it measures the 'return' (pre-tax profit) a company generates from capital employed in its business. To calculate this metric for Gaon Group, this is the formula:
Return on Capital Employed = Earnings Before Interest and Tax (EBIT) ÷ (Total Assets - Current Liabilities)
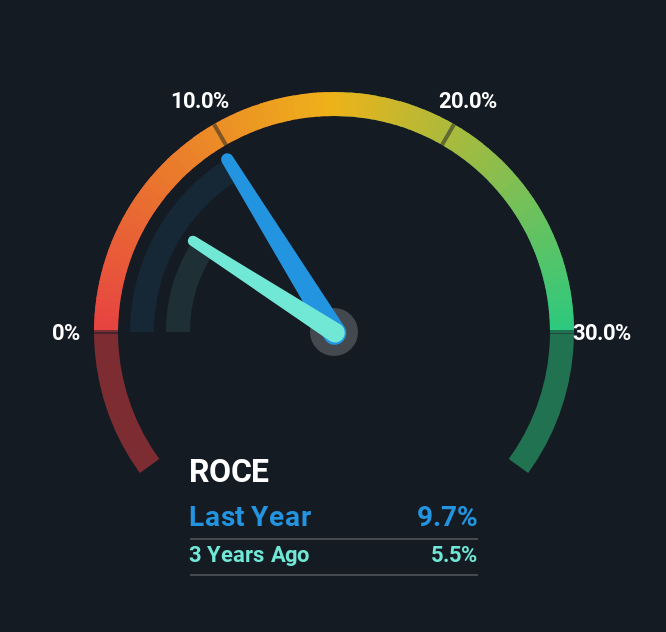
0.097 = ₪59m ÷ (₪1.0b - ₪427m) (Based on the trailing twelve months to March 2025).
Therefore, Gaon Group has an ROCE of 9.7%. On its own, that's a low figure but it's around the 8.3% average generated by the Metals and Mining industry.
View our latest analysis for Gaon Group
While the past is not representative of the future, it can be helpful to know how a company has performed historically, which is why we have this chart above. If you're interested in investigating Gaon Group's past further, check out this free graph covering Gaon Group's past earnings, revenue and cash flow.
So How Is Gaon Group's ROCE Trending?
Even though ROCE is still low in absolute terms, it's good to see it's heading in the right direction. The numbers show that in the last five years, the returns generated on capital employed have grown considerably to 9.7%. The company is effectively making more money per dollar of capital used, and it's worth noting that the amount of capital has increased too, by 23%. So we're very much inspired by what we're seeing at Gaon Group thanks to its ability to profitably reinvest capital.
On a separate but related note, it's important to know that Gaon Group has a current liabilities to total assets ratio of 41%, which we'd consider pretty high. This effectively means that suppliers (or short-term creditors) are funding a large portion of the business, so just be aware that this can introduce some elements of risk. Ideally we'd like to see this reduce as that would mean fewer obligations bearing risks.

In Conclusion...
To sum it up, Gaon Group has proven it can reinvest in the business and generate higher returns on that capital employed, which is terrific. Since the stock has returned a solid 57% to shareholders over the last five years, it's fair to say investors are beginning to recognize these changes. With that being said, we still think the promising fundamentals mean the company deserves some further due diligence.
On a final note, we found 4 warning signs for Gaon Group (2 are significant) you should be aware of.
While Gaon Group may not currently earn the highest returns, we've compiled a list of companies that currently earn more than 25% return on equity. Check out this free list here.
The New Payments ETF Is Live on NASDAQ:
Money is moving to real-time rails, and a newly listed ETF now gives investors direct exposure. Fast settlement. Institutional custody. Simple access.
Explore how this launch could reshape portfolios
Sponsored ContentNew: Manage All Your Stock Portfolios in One Place
We've created the ultimate portfolio companion for stock investors, and it's free.
• Connect an unlimited number of Portfolios and see your total in one currency
• Be alerted to new Warning Signs or Risks via email or mobile
• Track the Fair Value of your stocks
Have feedback on this article? Concerned about the content? Get in touch with us directly. Alternatively, email editorial-team (at) simplywallst.com.
This article by Simply Wall St is general in nature. We provide commentary based on historical data and analyst forecasts only using an unbiased methodology and our articles are not intended to be financial advice. It does not constitute a recommendation to buy or sell any stock, and does not take account of your objectives, or your financial situation. We aim to bring you long-term focused analysis driven by fundamental data. Note that our analysis may not factor in the latest price-sensitive company announcements or qualitative material. Simply Wall St has no position in any stocks mentioned.
About TASE:GAGR
Mediocre balance sheet and slightly overvalued.
Market Insights

Weekly Picks

THE KINGDOM OF BROWN GOODS: WHY MGPI IS BEING CRUSHED BY INVENTORY & PRIMED FOR RESURRECTION


Why Vertical Aerospace (NYSE: EVTL) is Worth Possibly Over 13x its Current Price


The Quiet Giant That Became AI’s Power Grid
Recently Updated Narratives

Butler National (Buks) outperforms.


A tech powerhouse quietly powering the world’s AI infrastructure.


Keppel DC REIT (SGX: AJBU) is a resilient gem in the data center space.
Popular Narratives

MicroVision will explode future revenue by 380.37% with a vision towards success


Crazy Undervalued 42 Baggers Silver Play (Active & Running Mine)


