- Israel
- /
- Oil and Gas
- /
- TASE:RATI
Is Ratio Oil Explorations (1992) – Limited Partnership (TLV:RATI.L) Using Too Much Debt?


David Iben put it well when he said, 'Volatility is not a risk we care about. What we care about is avoiding the permanent loss of capital.' So it might be obvious that you need to consider debt, when you think about how risky any given stock is, because too much debt can sink a company. Importantly, Ratio Oil Explorations (1992) – Limited Partnership (TLV:RATI.L) does carry debt. But the real question is whether this debt is making the company risky.
What Risk Does Debt Bring?
Generally speaking, debt only becomes a real problem when a company can't easily pay it off, either by raising capital or with its own cash flow. Ultimately, if the company can't fulfill its legal obligations to repay debt, shareholders could walk away with nothing. However, a more usual (but still expensive) situation is where a company must dilute shareholders at a cheap share price simply to get debt under control. Of course, the upside of debt is that it often represents cheap capital, especially when it replaces dilution in a company with the ability to reinvest at high rates of return. The first thing to do when considering how much debt a business uses is to look at its cash and debt together.
See our latest analysis for Ratio Oil Explorations (1992) – Limited Partnership
What Is Ratio Oil Explorations (1992) – Limited Partnership's Debt?
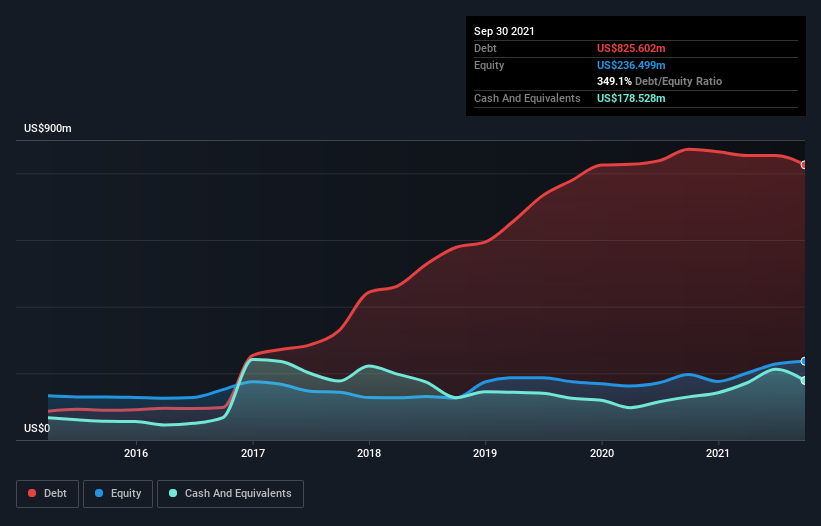
You can click the graphic below for the historical numbers, but it shows that Ratio Oil Explorations (1992) – Limited Partnership had US$825.6m of debt in September 2021, down from US$872.0m, one year before. However, it does have US$178.5m in cash offsetting this, leading to net debt of about US$647.1m.
A Look At Ratio Oil Explorations (1992) – Limited Partnership's Liabilities
We can see from the most recent balance sheet that Ratio Oil Explorations (1992) – Limited Partnership had liabilities of US$149.3m falling due within a year, and liabilities of US$738.7m due beyond that. Offsetting this, it had US$178.5m in cash and US$56.8m in receivables that were due within 12 months. So it has liabilities totalling US$652.7m more than its cash and near-term receivables, combined.
Given this deficit is actually higher than the company's market capitalization of US$642.8m, we think shareholders really should watch Ratio Oil Explorations (1992) – Limited Partnership's debt levels, like a parent watching their child ride a bike for the first time. Hypothetically, extremely heavy dilution would be required if the company were forced to pay down its liabilities by raising capital at the current share price.
In order to size up a company's debt relative to its earnings, we calculate its net debt divided by its earnings before interest, tax, depreciation, and amortization (EBITDA) and its earnings before interest and tax (EBIT) divided by its interest expense (its interest cover). This way, we consider both the absolute quantum of the debt, as well as the interest rates paid on it.
Ratio Oil Explorations (1992) – Limited Partnership has a debt to EBITDA ratio of 3.4 and its EBIT covered its interest expense 2.8 times. Taken together this implies that, while we wouldn't want to see debt levels rise, we think it can handle its current leverage. However, it should be some comfort for shareholders to recall that Ratio Oil Explorations (1992) – Limited Partnership actually grew its EBIT by a hefty 102%, over the last 12 months. If it can keep walking that path it will be in a position to shed its debt with relative ease. The balance sheet is clearly the area to focus on when you are analysing debt. But ultimately the future profitability of the business will decide if Ratio Oil Explorations (1992) – Limited Partnership can strengthen its balance sheet over time. So if you want to see what the professionals think, you might find this free report on analyst profit forecasts to be interesting.
Finally, a business needs free cash flow to pay off debt; accounting profits just don't cut it. So we always check how much of that EBIT is translated into free cash flow. In the last two years, Ratio Oil Explorations (1992) – Limited Partnership created free cash flow amounting to 14% of its EBIT, an uninspiring performance. That limp level of cash conversion undermines its ability to manage and pay down debt.
Our View
To be frank both Ratio Oil Explorations (1992) – Limited Partnership's level of total liabilities and its track record of covering its interest expense with its EBIT make us rather uncomfortable with its debt levels. But at least it's pretty decent at growing its EBIT; that's encouraging. Once we consider all the factors above, together, it seems to us that Ratio Oil Explorations (1992) – Limited Partnership's debt is making it a bit risky. That's not necessarily a bad thing, but we'd generally feel more comfortable with less leverage. When analysing debt levels, the balance sheet is the obvious place to start. But ultimately, every company can contain risks that exist outside of the balance sheet. To that end, you should learn about the 2 warning signs we've spotted with Ratio Oil Explorations (1992) – Limited Partnership (including 1 which doesn't sit too well with us) .
If you're interested in investing in businesses that can grow profits without the burden of debt, then check out this free list of growing businesses that have net cash on the balance sheet.
New: AI Stock Screener & Alerts
Our new AI Stock Screener scans the market every day to uncover opportunities.
• Dividend Powerhouses (3%+ Yield)
• Undervalued Small Caps with Insider Buying
• High growth Tech and AI Companies
Or build your own from over 50 metrics.
Have feedback on this article? Concerned about the content? Get in touch with us directly. Alternatively, email editorial-team (at) simplywallst.com.
This article by Simply Wall St is general in nature. We provide commentary based on historical data and analyst forecasts only using an unbiased methodology and our articles are not intended to be financial advice. It does not constitute a recommendation to buy or sell any stock, and does not take account of your objectives, or your financial situation. We aim to bring you long-term focused analysis driven by fundamental data. Note that our analysis may not factor in the latest price-sensitive company announcements or qualitative material. Simply Wall St has no position in any stocks mentioned.
About TASE:RATI
Ratio Energies - Limited Partnership
Explores, develops, and produces oil and natural gas in Israel and internationally.
Good value with proven track record.
Market Insights

Community Narratives


