- Israel
- /
- Consumer Durables
- /
- TASE:DNYA
Danya Cebus Ltd. (TLV:DNYA) Stock Has Shown Weakness Lately But Financials Look Strong: Should Prospective Shareholders Make The Leap?

With its stock down 24% over the past month, it is easy to disregard Danya Cebus (TLV:DNYA). However, a closer look at its sound financials might cause you to think again. Given that fundamentals usually drive long-term market outcomes, the company is worth looking at. Particularly, we will be paying attention to Danya Cebus' ROE today.
ROE or return on equity is a useful tool to assess how effectively a company can generate returns on the investment it received from its shareholders. In other words, it is a profitability ratio which measures the rate of return on the capital provided by the company's shareholders.
How Do You Calculate Return On Equity?
Return on equity can be calculated by using the formula:
Return on Equity = Net Profit (from continuing operations) ÷ Shareholders' Equity
So, based on the above formula, the ROE for Danya Cebus is:
23% = ₪174m ÷ ₪767m (Based on the trailing twelve months to December 2024).
The 'return' is the profit over the last twelve months. That means that for every ₪1 worth of shareholders' equity, the company generated ₪0.23 in profit.
See our latest analysis for Danya Cebus
What Has ROE Got To Do With Earnings Growth?
Thus far, we have learned that ROE measures how efficiently a company is generating its profits. Based on how much of its profits the company chooses to reinvest or "retain", we are then able to evaluate a company's future ability to generate profits. Assuming all else is equal, companies that have both a higher return on equity and higher profit retention are usually the ones that have a higher growth rate when compared to companies that don't have the same features.
Danya Cebus' Earnings Growth And 23% ROE
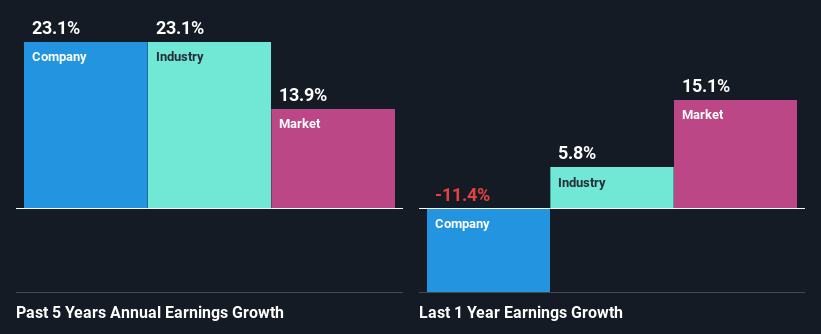
At first glance, Danya Cebus seems to have a decent ROE. Further, the company's ROE is similar to the industry average of 23%. This certainly adds some context to Danya Cebus' exceptional 23% net income growth seen over the past five years. We believe that there might also be other aspects that are positively influencing the company's earnings growth. For instance, the company has a low payout ratio or is being managed efficiently.
As a next step, we compared Danya Cebus' net income growth with the industry and found that the company has a similar growth figure when compared with the industry average growth rate of 23% in the same period.
The basis for attaching value to a company is, to a great extent, tied to its earnings growth. What investors need to determine next is if the expected earnings growth, or the lack of it, is already built into the share price. Doing so will help them establish if the stock's future looks promising or ominous. One good indicator of expected earnings growth is the P/E ratio which determines the price the market is willing to pay for a stock based on its earnings prospects. So, you may want to check if Danya Cebus is trading on a high P/E or a low P/E, relative to its industry.
Is Danya Cebus Using Its Retained Earnings Effectively?
The high three-year median payout ratio of 79% (implying that it keeps only 21% of profits) for Danya Cebus suggests that the company's growth wasn't really hampered despite it returning most of the earnings to its shareholders.
Additionally, Danya Cebus has paid dividends over a period of four years which means that the company is pretty serious about sharing its profits with shareholders.
Summary
In total, we are pretty happy with Danya Cebus' performance. We are particularly impressed by the considerable earnings growth posted by the company, which was likely backed by its high ROE. While the company is paying out most of its earnings as dividends, it has been able to grow its earnings in spite of it, so that's probably a good sign. Until now, we have only just grazed the surface of the company's past performance by looking at the company's fundamentals. You can do your own research on Danya Cebus and see how it has performed in the past by looking at this FREE detailed graph of past earnings, revenue and cash flows.
Mobile Infrastructure for Defense and Disaster
The next wave in robotics isn't humanoid. Its fully autonomous towers delivering 5G, ISR, and radar in under 30 minutes, anywhere.
Get the investor briefing before the next round of contracts
Sponsored On Behalf of CiTechNew: Manage All Your Stock Portfolios in One Place
We've created the ultimate portfolio companion for stock investors, and it's free.
• Connect an unlimited number of Portfolios and see your total in one currency
• Be alerted to new Warning Signs or Risks via email or mobile
• Track the Fair Value of your stocks
Have feedback on this article? Concerned about the content? Get in touch with us directly. Alternatively, email editorial-team (at) simplywallst.com.
This article by Simply Wall St is general in nature. We provide commentary based on historical data and analyst forecasts only using an unbiased methodology and our articles are not intended to be financial advice. It does not constitute a recommendation to buy or sell any stock, and does not take account of your objectives, or your financial situation. We aim to bring you long-term focused analysis driven by fundamental data. Note that our analysis may not factor in the latest price-sensitive company announcements or qualitative material. Simply Wall St has no position in any stocks mentioned.
About TASE:DNYA
Danya Cebus
Operates as a construction and infrastructure company in Israel and internationally.
Flawless balance sheet with very low risk.
Similar Companies
Market Insights

Weekly Picks

THE KINGDOM OF BROWN GOODS: WHY MGPI IS BEING CRUSHED BY INVENTORY & PRIMED FOR RESURRECTION


Why Vertical Aerospace (NYSE: EVTL) is Worth Possibly Over 13x its Current Price


The Quiet Giant That Became AI’s Power Grid
Recently Updated Narratives


A case for CA$31.80 (undiluted), aka 8,616% upside from CA$0.37 (an 86 bagger!).


Unicycive Therapeutics (Nasdaq: UNCY) – Preparing for a Second Shot at Bringing a New Kidney Treatment to Market (TEST)

Rocket Lab USA Will Ignite a 30% Revenue Growth Journey
Popular Narratives


MicroVision will explode future revenue by 380.37% with a vision towards success


NVDA: Expanding AI Demand Will Drive Major Data Center Investments Through 2026


Crazy Undervalued 42 Baggers Silver Play (Active & Running Mine)
Trending Discussion