Some Confidence Is Lacking In Hamat Group Ltd. (TLV:HAMAT) As Shares Slide 27%

Unfortunately for some shareholders, the Hamat Group Ltd. (TLV:HAMAT) share price has dived 27% in the last thirty days, prolonging recent pain. Longer-term shareholders would now have taken a real hit with the stock declining 9.4% in the last year.
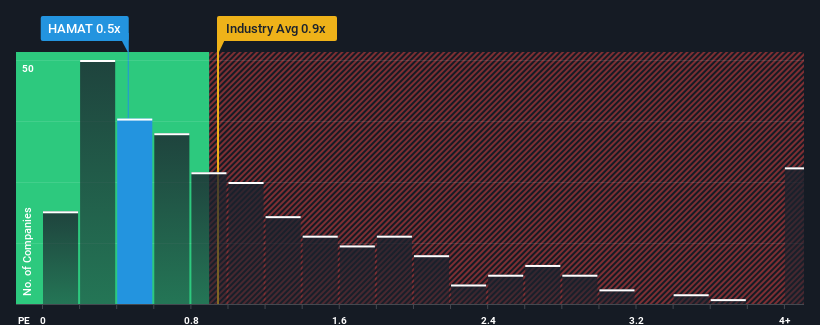
Even after such a large drop in price, there still wouldn't be many who think Hamat Group's price-to-sales (or "P/S") ratio of 0.5x is worth a mention when the median P/S in Israel's Building industry is similar at about 0.6x. Although, it's not wise to simply ignore the P/S without explanation as investors may be disregarding a distinct opportunity or a costly mistake.
Check out our latest analysis for Hamat Group
How Has Hamat Group Performed Recently?
As an illustration, revenue has deteriorated at Hamat Group over the last year, which is not ideal at all. One possibility is that the P/S is moderate because investors think the company might still do enough to be in line with the broader industry in the near future. If you like the company, you'd at least be hoping this is the case so that you could potentially pick up some stock while it's not quite in favour.
Although there are no analyst estimates available for Hamat Group, take a look at this free data-rich visualisation to see how the company stacks up on earnings, revenue and cash flow.Is There Some Revenue Growth Forecasted For Hamat Group?
Hamat Group's P/S ratio would be typical for a company that's only expected to deliver moderate growth, and importantly, perform in line with the industry.
In reviewing the last year of financials, we were disheartened to see the company's revenues fell to the tune of 8.3%. This has soured the latest three-year period, which nevertheless managed to deliver a decent 7.6% overall rise in revenue. Although it's been a bumpy ride, it's still fair to say the revenue growth recently has been mostly respectable for the company.
Comparing the recent medium-term revenue trends against the industry's one-year growth forecast of 7.6% shows it's noticeably less attractive.
With this in mind, we find it intriguing that Hamat Group's P/S is comparable to that of its industry peers. Apparently many investors in the company are less bearish than recent times would indicate and aren't willing to let go of their stock right now. Maintaining these prices will be difficult to achieve as a continuation of recent revenue trends is likely to weigh down the shares eventually.
What Does Hamat Group's P/S Mean For Investors?
With its share price dropping off a cliff, the P/S for Hamat Group looks to be in line with the rest of the Building industry. Generally, our preference is to limit the use of the price-to-sales ratio to establishing what the market thinks about the overall health of a company.
We've established that Hamat Group's average P/S is a bit surprising since its recent three-year growth is lower than the wider industry forecast. Right now we are uncomfortable with the P/S as this revenue performance isn't likely to support a more positive sentiment for long. Unless there is a significant improvement in the company's medium-term performance, it will be difficult to prevent the P/S ratio from declining to a more reasonable level.
There are also other vital risk factors to consider and we've discovered 5 warning signs for Hamat Group (2 are a bit concerning!) that you should be aware of before investing here.
It's important to make sure you look for a great company, not just the first idea you come across. So if growing profitability aligns with your idea of a great company, take a peek at this free list of interesting companies with strong recent earnings growth (and a low P/E).
The New Payments ETF Is Live on NASDAQ:
Money is moving to real-time rails, and a newly listed ETF now gives investors direct exposure. Fast settlement. Institutional custody. Simple access.
Explore how this launch could reshape portfolios
Sponsored ContentValuation is complex, but we're here to simplify it.
Discover if Hamat Group might be undervalued or overvalued with our detailed analysis, featuring fair value estimates, potential risks, dividends, insider trades, and its financial condition.
Access Free AnalysisHave feedback on this article? Concerned about the content? Get in touch with us directly. Alternatively, email editorial-team (at) simplywallst.com.
This article by Simply Wall St is general in nature. We provide commentary based on historical data and analyst forecasts only using an unbiased methodology and our articles are not intended to be financial advice. It does not constitute a recommendation to buy or sell any stock, and does not take account of your objectives, or your financial situation. We aim to bring you long-term focused analysis driven by fundamental data. Note that our analysis may not factor in the latest price-sensitive company announcements or qualitative material. Simply Wall St has no position in any stocks mentioned.
About TASE:HAMAT
Hamat Group
Engages in the production, development, import, marketing, distribution, and sale of home design and construction finishing products for bathrooms, toilets, and kitchens in Israel and internationally.
Moderate risk with acceptable track record.
Market Insights

Weekly Picks

THE KINGDOM OF BROWN GOODS: WHY MGPI IS BEING CRUSHED BY INVENTORY & PRIMED FOR RESURRECTION


Why Vertical Aerospace (NYSE: EVTL) is Worth Possibly Over 13x its Current Price


The Quiet Giant That Became AI’s Power Grid
Recently Updated Narratives


A case for CA$31.80 (undiluted), aka 8,616% upside from CA$0.37 (an 86 bagger!).


Unicycive Therapeutics (Nasdaq: UNCY) – Preparing for a Second Shot at Bringing a New Kidney Treatment to Market (TEST)

Rocket Lab USA Will Ignite a 30% Revenue Growth Journey
Popular Narratives


MicroVision will explode future revenue by 380.37% with a vision towards success


NVDA: Expanding AI Demand Will Drive Major Data Center Investments Through 2026


