- China
- /
- Electronic Equipment and Components
- /
- SZSE:301589
3 Stocks That Investors Might Be Undervaluing By Up To 43.3%

Reviewed by Simply Wall St

In the current global market landscape, investors are navigating a complex environment marked by fluctuating interest rates, geopolitical tensions, and volatile corporate earnings. With U.S. stocks experiencing a mixed performance and European markets buoyed by strong earnings and monetary easing, identifying undervalued opportunities becomes crucial for investors seeking potential value amidst uncertainty. In such conditions, a good stock is often characterized by solid fundamentals that may be temporarily overlooked due to broader market volatility or sector-specific disruptions.
Top 10 Undervalued Stocks Based On Cash Flows
| Name | Current Price | Fair Value (Est) | Discount (Est) |
| Old National Bancorp (NasdaqGS:ONB) | US$24.45 | US$48.78 | 49.9% |
| Decisive Dividend (TSXV:DE) | CA$5.96 | CA$11.91 | 50% |
| Tongqinglou Catering (SHSE:605108) | CN¥20.86 | CN¥41.63 | 49.9% |
| Telefonaktiebolaget LM Ericsson (OM:ERIC B) | SEK83.14 | SEK165.53 | 49.8% |
| Solum (KOSE:A248070) | ₩18800.00 | ₩37257.19 | 49.5% |
| AbbVie (NYSE:ABBV) | US$192.97 | US$385.39 | 49.9% |
| Semiconductor Manufacturing International (SEHK:981) | HK$47.90 | HK$95.26 | 49.7% |
| Verra Mobility (NasdaqCM:VRRM) | US$25.88 | US$51.66 | 49.9% |
| Facephi Biometria (BME:FACE) | €2.24 | €4.46 | 49.7% |
| Sandfire Resources (ASX:SFR) | A$10.33 | A$20.47 | 49.5% |
Let's uncover some gems from our specialized screener.
Xi'an NovaStar Tech (SZSE:301589)
Overview: Xi'an NovaStar Tech Co., Ltd. offers LED display control solutions in China and has a market cap of CN¥15.80 billion.
Operations: The company generates revenue from its Electronic Components & Parts segment, totaling CN¥3.28 billion.
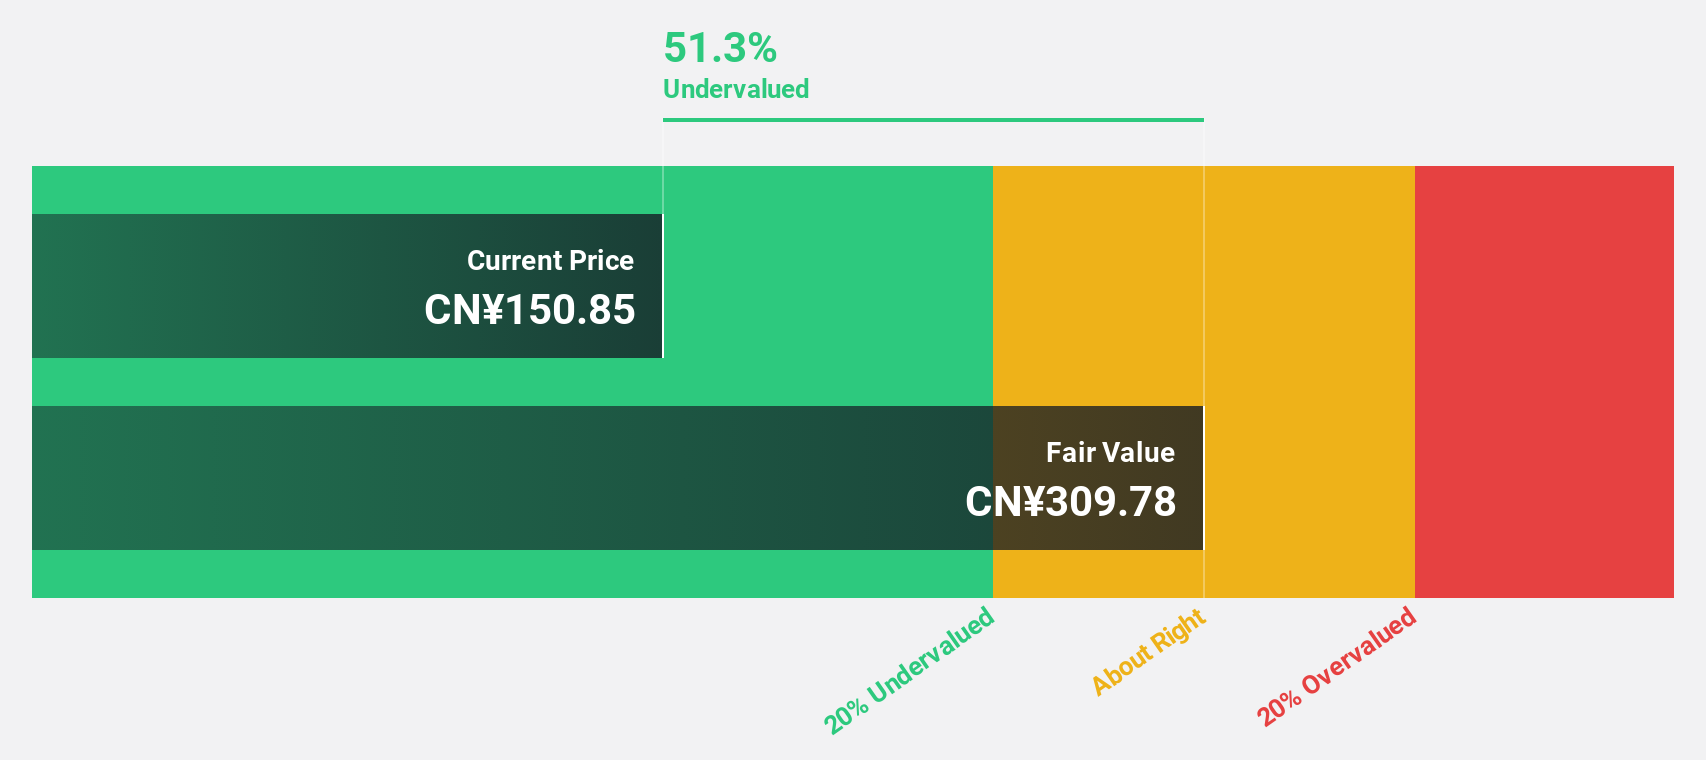
Estimated Discount To Fair Value: 43.3%
Xi'an NovaStar Tech is trading significantly below its estimated fair value of CNY 301.48, with a current price of CNY 170.95, suggesting it may be undervalued based on cash flows. The company's earnings and revenue are expected to grow substantially faster than the Chinese market average, at rates of 35.3% and 30.2% per year respectively. However, its dividend yield of 3.15% is not well covered by free cash flows, indicating potential sustainability concerns despite high forecasted returns on equity and robust profit growth projections.
- Our earnings growth report unveils the potential for significant increases in Xi'an NovaStar Tech's future results.
- Click here to discover the nuances of Xi'an NovaStar Tech with our detailed financial health report.
Elbit Systems (TASE:ESLT)
Overview: Elbit Systems Ltd. is a company that develops and supplies a range of systems and products for defense, homeland security, and commercial aviation applications across various regions including Israel, North America, the Asia-Pacific, Europe, Latin America, and internationally with a market cap of ₪48.58 billion.
Operations: The company's revenue segments include ESA ($1.56 billion), Land ($1.57 billion), Aerospace ($1.90 billion), ISTAR and EW ($1.29 billion), and C4I and Cyber ($786.72 million).
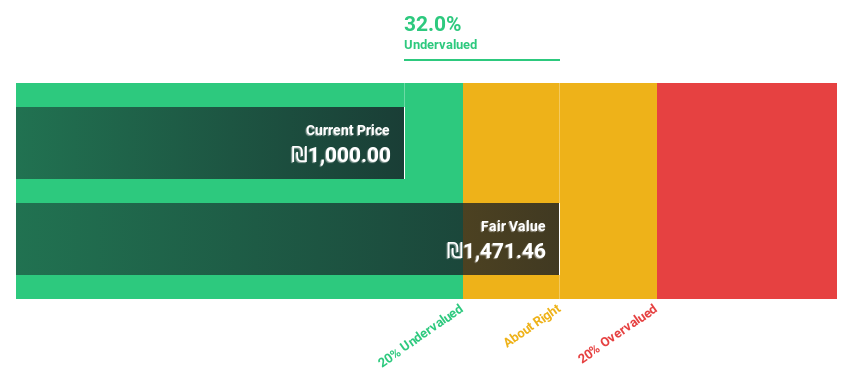
Estimated Discount To Fair Value: 23.5%
Elbit Systems is trading 23.5% below its estimated fair value of ₪1425.27, with a current price of ₪1090, highlighting potential undervaluation based on cash flows. The company recently secured contracts worth $510 million for defense systems and electronic warfare suites, which could bolster future cash flows. Earnings are forecast to grow at 20.2% annually, outpacing the Israeli market's growth rate and supporting its valuation prospects despite slower revenue growth projections at 10.1%.
- The growth report we've compiled suggests that Elbit Systems' future prospects could be on the up.
- Dive into the specifics of Elbit Systems here with our thorough financial health report.
COVER (TSE:5253)
Overview: COVER Corporation operates in the virtual platform, VTuber production, and media mix sectors, with a market cap of ¥193.27 billion.
Operations: The company's revenue is derived from its virtual platform, VTuber production, and media mix businesses.
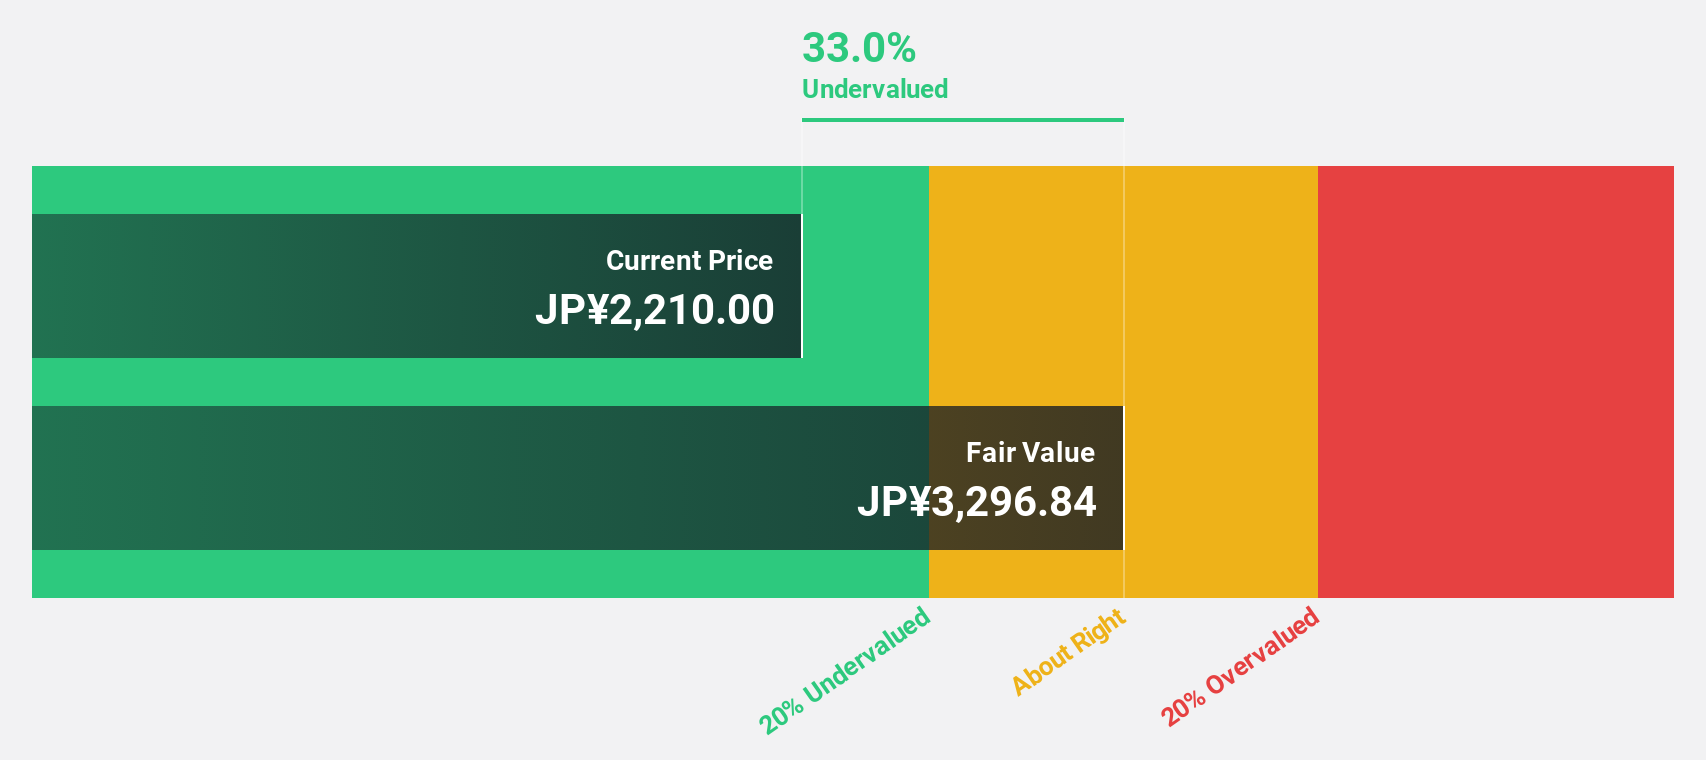
Estimated Discount To Fair Value: 13.8%
COVER is trading at ¥3105, below its estimated fair value of ¥3600.48, indicating potential undervaluation based on cash flows. Earnings are projected to grow significantly at 25.7% annually, outpacing the JP market's 8% growth rate, while revenue is expected to increase by 17.9% per year. Despite high non-cash earnings and recent volatility in share price, COVER's robust profit growth and strong return on equity forecast enhance its valuation appeal.
- Insights from our recent growth report point to a promising forecast for COVER's business outlook.
- Delve into the full analysis health report here for a deeper understanding of COVER.
Seize The Opportunity
- Click here to access our complete index of 921 Undervalued Stocks Based On Cash Flows.
- Shareholder in one or more of these companies? Ensure you're never caught off-guard by adding your portfolio in Simply Wall St for timely alerts on significant stock developments.
- Elevate your portfolio with Simply Wall St, the ultimate app for investors seeking global market coverage.
Want To Explore Some Alternatives?
- Explore high-performing small cap companies that haven't yet garnered significant analyst attention.
- Diversify your portfolio with solid dividend payers offering reliable income streams to weather potential market turbulence.
- Fuel your portfolio with companies showing strong growth potential, backed by optimistic outlooks both from analysts and management.
This article by Simply Wall St is general in nature. We provide commentary based on historical data and analyst forecasts only using an unbiased methodology and our articles are not intended to be financial advice. It does not constitute a recommendation to buy or sell any stock, and does not take account of your objectives, or your financial situation. We aim to bring you long-term focused analysis driven by fundamental data. Note that our analysis may not factor in the latest price-sensitive company announcements or qualitative material. Simply Wall St has no position in any stocks mentioned.
If you're looking to trade Xi'an NovaStar Tech, open an account with the lowest-cost platform trusted by professionals, Interactive Brokers.
With clients in over 200 countries and territories, and access to 160 markets, IBKR lets you trade stocks, options, futures, forex, bonds and funds from a single integrated account.
Enjoy no hidden fees, no account minimums, and FX conversion rates as low as 0.03%, far better than what most brokers offer.
Sponsored ContentNew: AI Stock Screener & Alerts
Our new AI Stock Screener scans the market every day to uncover opportunities.
• Dividend Powerhouses (3%+ Yield)
• Undervalued Small Caps with Insider Buying
• High growth Tech and AI Companies
Or build your own from over 50 metrics.
Have feedback on this article? Concerned about the content? Get in touch with us directly. Alternatively, email editorial-team@simplywallst.com
About SZSE:301589
Exceptional growth potential and undervalued.
