

Legendary fund manager Li Lu (who Charlie Munger backed) once said, 'The biggest investment risk is not the volatility of prices, but whether you will suffer a permanent loss of capital.' So it might be obvious that you need to consider debt, when you think about how risky any given stock is, because too much debt can sink a company. As with many other companies C&N Holdings Limited (HKG:8430) makes use of debt. But the real question is whether this debt is making the company risky.
When Is Debt Dangerous?
Debt and other liabilities become risky for a business when it cannot easily fulfill those obligations, either with free cash flow or by raising capital at an attractive price. If things get really bad, the lenders can take control of the business. However, a more frequent (but still costly) occurrence is where a company must issue shares at bargain-basement prices, permanently diluting shareholders, just to shore up its balance sheet. Having said that, the most common situation is where a company manages its debt reasonably well - and to its own advantage. When we examine debt levels, we first consider both cash and debt levels, together.
See our latest analysis for C&N Holdings
What Is C&N Holdings's Debt?
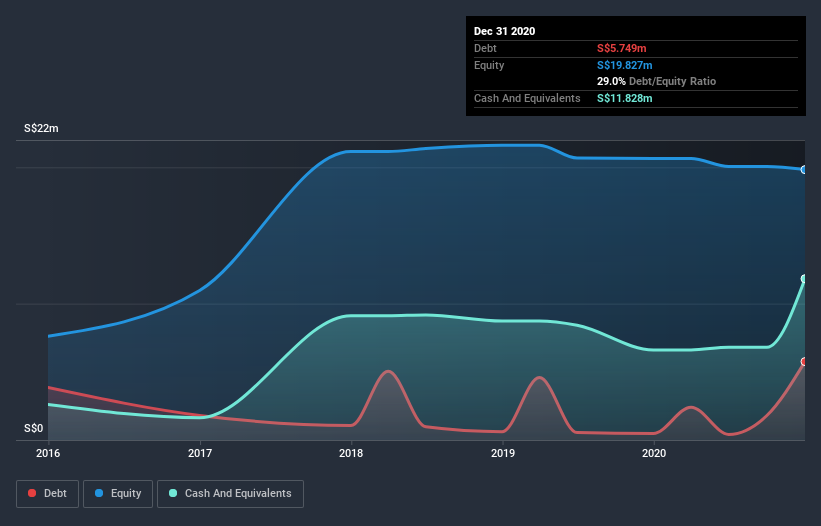
The image below, which you can click on for greater detail, shows that at December 2020 C&N Holdings had debt of S$4.36m, up from S$475.5k in one year. However, its balance sheet shows it holds S$11.8m in cash, so it actually has S$7.46m net cash.
How Strong Is C&N Holdings' Balance Sheet?
We can see from the most recent balance sheet that C&N Holdings had liabilities of S$4.11m falling due within a year, and liabilities of S$4.85m due beyond that. On the other hand, it had cash of S$11.8m and S$4.52m worth of receivables due within a year. So it actually has S$7.39m more liquid assets than total liabilities.
This excess liquidity is a great indication that C&N Holdings' balance sheet is almost as strong as Fort Knox. Having regard to this fact, we think its balance sheet is as strong as an ox. Succinctly put, C&N Holdings boasts net cash, so it's fair to say it does not have a heavy debt load! The balance sheet is clearly the area to focus on when you are analysing debt. But it is C&N Holdings's earnings that will influence how the balance sheet holds up in the future. So if you're keen to discover more about its earnings, it might be worth checking out this graph of its long term earnings trend.
In the last year C&N Holdings had a loss before interest and tax, and actually shrunk its revenue by 8.6%, to S$26m. We would much prefer see growth.
So How Risky Is C&N Holdings?
While C&N Holdings lost money on an earnings before interest and tax (EBIT) level, it actually generated positive free cash flow S$1.2m. So although it is loss-making, it doesn't seem to have too much near-term balance sheet risk, keeping in mind the net cash. With mediocre revenue growth in the last year, we're don't find the investment opportunity particularly compelling. There's no doubt that we learn most about debt from the balance sheet. However, not all investment risk resides within the balance sheet - far from it. We've identified 3 warning signs with C&N Holdings (at least 1 which doesn't sit too well with us) , and understanding them should be part of your investment process.
Of course, if you're the type of investor who prefers buying stocks without the burden of debt, then don't hesitate to discover our exclusive list of net cash growth stocks, today.
If you’re looking to trade C&N Holdings, open an account with the lowest-cost* platform trusted by professionals, Interactive Brokers. Their clients from over 200 countries and territories trade stocks, options, futures, forex, bonds and funds worldwide from a single integrated account. Promoted
New: AI Stock Screener & Alerts
Our new AI Stock Screener scans the market every day to uncover opportunities.
• Dividend Powerhouses (3%+ Yield)
• Undervalued Small Caps with Insider Buying
• High growth Tech and AI Companies
Or build your own from over 50 metrics.
This article by Simply Wall St is general in nature. It does not constitute a recommendation to buy or sell any stock, and does not take account of your objectives, or your financial situation. We aim to bring you long-term focused analysis driven by fundamental data. Note that our analysis may not factor in the latest price-sensitive company announcements or qualitative material. Simply Wall St has no position in any stocks mentioned.
*Interactive Brokers Rated Lowest Cost Broker by StockBrokers.com Annual Online Review 2020
Have feedback on this article? Concerned about the content? Get in touch with us directly. Alternatively, email editorial-team (at) simplywallst.com.
About SEHK:8430
C&N Holdings
An investment holding company, provides transport and storage services to the logistics industry in Singapore.
Excellent balance sheet low.
Market Insights

Community Narratives


