

David Iben put it well when he said, 'Volatility is not a risk we care about. What we care about is avoiding the permanent loss of capital.' So it seems the smart money knows that debt - which is usually involved in bankruptcies - is a very important factor, when you assess how risky a company is. Importantly, C&N Holdings Limited (HKG:8430) does carry debt. But the real question is whether this debt is making the company risky.
When Is Debt Dangerous?
Debt is a tool to help businesses grow, but if a business is incapable of paying off its lenders, then it exists at their mercy. Part and parcel of capitalism is the process of 'creative destruction' where failed businesses are mercilessly liquidated by their bankers. However, a more frequent (but still costly) occurrence is where a company must issue shares at bargain-basement prices, permanently diluting shareholders, just to shore up its balance sheet. Of course, the upside of debt is that it often represents cheap capital, especially when it replaces dilution in a company with the ability to reinvest at high rates of return. When we think about a company's use of debt, we first look at cash and debt together.
Check out our latest analysis for C&N Holdings
What Is C&N Holdings's Debt?
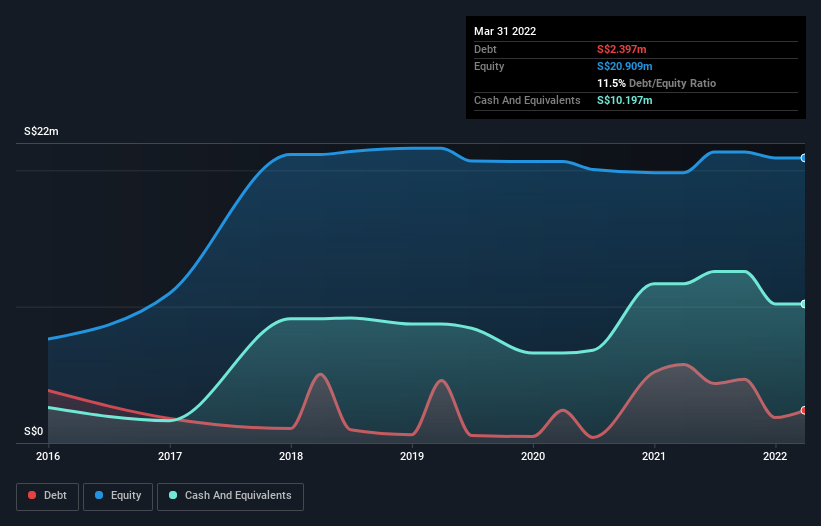
You can click the graphic below for the historical numbers, but it shows that C&N Holdings had S$2.40m of debt in December 2021, down from S$5.75m, one year before. However, it does have S$10.2m in cash offsetting this, leading to net cash of S$7.80m.
How Strong Is C&N Holdings' Balance Sheet?
According to the last reported balance sheet, C&N Holdings had liabilities of S$3.58m due within 12 months, and liabilities of S$1.27m due beyond 12 months. Offsetting these obligations, it had cash of S$10.2m as well as receivables valued at S$3.84m due within 12 months. So it can boast S$9.19m more liquid assets than total liabilities.
This surplus liquidity suggests that C&N Holdings' balance sheet could take a hit just as well as Homer Simpson's head can take a punch. With this in mind one could posit that its balance sheet means the company is able to handle some adversity. Simply put, the fact that C&N Holdings has more cash than debt is arguably a good indication that it can manage its debt safely. There's no doubt that we learn most about debt from the balance sheet. But it is C&N Holdings's earnings that will influence how the balance sheet holds up in the future. So if you're keen to discover more about its earnings, it might be worth checking out this graph of its long term earnings trend.
Over 12 months, C&N Holdings made a loss at the EBIT level, and saw its revenue drop to S$26m, which is a fall of 4.2%. That's not what we would hope to see.
So How Risky Is C&N Holdings?
We have no doubt that loss making companies are, in general, riskier than profitable ones. And the fact is that over the last twelve months C&N Holdings lost money at the earnings before interest and tax (EBIT) line. Indeed, in that time it burnt through S$883k of cash and made a loss of S$4.9m. Given it only has net cash of S$7.80m, the company may need to raise more capital if it doesn't reach break-even soon. Even though its balance sheet seems sufficiently liquid, debt always makes us a little nervous if a company doesn't produce free cash flow regularly. There's no doubt that we learn most about debt from the balance sheet. However, not all investment risk resides within the balance sheet - far from it. Case in point: We've spotted 4 warning signs for C&N Holdings you should be aware of, and 2 of them are concerning.
If, after all that, you're more interested in a fast growing company with a rock-solid balance sheet, then check out our list of net cash growth stocks without delay.
New: AI Stock Screener & Alerts
Our new AI Stock Screener scans the market every day to uncover opportunities.
• Dividend Powerhouses (3%+ Yield)
• Undervalued Small Caps with Insider Buying
• High growth Tech and AI Companies
Or build your own from over 50 metrics.
Have feedback on this article? Concerned about the content? Get in touch with us directly. Alternatively, email editorial-team (at) simplywallst.com.
This article by Simply Wall St is general in nature. We provide commentary based on historical data and analyst forecasts only using an unbiased methodology and our articles are not intended to be financial advice. It does not constitute a recommendation to buy or sell any stock, and does not take account of your objectives, or your financial situation. We aim to bring you long-term focused analysis driven by fundamental data. Note that our analysis may not factor in the latest price-sensitive company announcements or qualitative material. Simply Wall St has no position in any stocks mentioned.
About SEHK:8430
C&N Holdings
An investment holding company, provides transport and storage services to the logistics industry in Singapore.
Excellent balance sheet low.
Market Insights

Community Narratives


