- Hong Kong
- /
- Telecom Services and Carriers
- /
- SEHK:788
Will China Tower's (HKG:788) Growth In ROCE Persist?


If you're not sure where to start when looking for the next multi-bagger, there are a few key trends you should keep an eye out for. One common approach is to try and find a company with returns on capital employed (ROCE) that are increasing, in conjunction with a growing amount of capital employed. If you see this, it typically means it's a company with a great business model and plenty of profitable reinvestment opportunities. With that in mind, we've noticed some promising trends at China Tower (HKG:788) so let's look a bit deeper.
Return On Capital Employed (ROCE): What is it?
If you haven't worked with ROCE before, it measures the 'return' (pre-tax profit) a company generates from capital employed in its business. To calculate this metric for China Tower, this is the formula:
Return on Capital Employed = Earnings Before Interest and Tax (EBIT) ÷ (Total Assets - Current Liabilities)
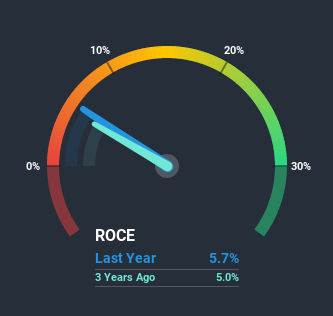
0.057 = CN¥13b ÷ (CN¥339b - CN¥113b) (Based on the trailing twelve months to September 2020).
Therefore, China Tower has an ROCE of 5.7%. On its own that's a low return on capital but it's in line with the industry's average returns of 5.7%.
View our latest analysis for China Tower
In the above chart we have measured China Tower's prior ROCE against its prior performance, but the future is arguably more important. If you'd like to see what analysts are forecasting going forward, you should check out our free report for China Tower.
How Are Returns Trending?
We're glad to see that ROCE is heading in the right direction, even if it is still low at the moment. Over the last four years, returns on capital employed have risen substantially to 5.7%. The company is effectively making more money per dollar of capital used, and it's worth noting that the amount of capital has increased too, by 40%. This can indicate that there's plenty of opportunities to invest capital internally and at ever higher rates, a combination that's common among multi-baggers.
On a related note, the company's ratio of current liabilities to total assets has decreased to 33%, which basically reduces it's funding from the likes of short-term creditors or suppliers. So shareholders would be pleased that the growth in returns has mostly come from underlying business performance.What We Can Learn From China Tower's ROCE
To sum it up, China Tower has proven it can reinvest in the business and generate higher returns on that capital employed, which is terrific. And since the stock has fallen 25% over the last year, there might be an opportunity here. That being the case, research into the company's current valuation metrics and future prospects seems fitting.
China Tower does have some risks though, and we've spotted 1 warning sign for China Tower that you might be interested in.
While China Tower isn't earning the highest return, check out this free list of companies that are earning high returns on equity with solid balance sheets.
If you’re looking to trade China Tower, open an account with the lowest-cost* platform trusted by professionals, Interactive Brokers. Their clients from over 200 countries and territories trade stocks, options, futures, forex, bonds and funds worldwide from a single integrated account. Promoted
If you're looking to trade China Tower, open an account with the lowest-cost platform trusted by professionals, Interactive Brokers.
With clients in over 200 countries and territories, and access to 160 markets, IBKR lets you trade stocks, options, futures, forex, bonds and funds from a single integrated account.
Enjoy no hidden fees, no account minimums, and FX conversion rates as low as 0.03%, far better than what most brokers offer.
Sponsored ContentNew: AI Stock Screener & Alerts
Our new AI Stock Screener scans the market every day to uncover opportunities.
• Dividend Powerhouses (3%+ Yield)
• Undervalued Small Caps with Insider Buying
• High growth Tech and AI Companies
Or build your own from over 50 metrics.
This article by Simply Wall St is general in nature. It does not constitute a recommendation to buy or sell any stock, and does not take account of your objectives, or your financial situation. We aim to bring you long-term focused analysis driven by fundamental data. Note that our analysis may not factor in the latest price-sensitive company announcements or qualitative material. Simply Wall St has no position in any stocks mentioned.
*Interactive Brokers Rated Lowest Cost Broker by StockBrokers.com Annual Online Review 2020
Have feedback on this article? Concerned about the content? Get in touch with us directly. Alternatively, email editorial-team@simplywallst.com.
About SEHK:788
China Tower
Provides telecommunication tower infrastructure services in the People's Republic of China.
Very undervalued with flawless balance sheet.

