
Advertisement
- Hong Kong
- /
- Telecom Services and Carriers
- /
- SEHK:6823
Those who invested in HKT Trust and HKT (HKG:6823) a year ago are up 33%

Passive investing in index funds can generate returns that roughly match the overall market. But you can significantly boost your returns by picking above-average stocks. To wit, the HKT Trust and HKT Limited (HKG:6823) share price is 22% higher than it was a year ago, much better than the market return of around 18% (not including dividends) in the same period. If it can keep that out-performance up over the long term, investors will do very well! Unfortunately the longer term returns are not so good, with the stock falling 6.6% in the last three years.
So let's investigate and see if the longer term performance of the company has been in line with the underlying business' progress.
Check out our latest analysis for HKT Trust and HKT
To quote Buffett, 'Ships will sail around the world but the Flat Earth Society will flourish. There will continue to be wide discrepancies between price and value in the marketplace...' By comparing earnings per share (EPS) and share price changes over time, we can get a feel for how investor attitudes to a company have morphed over time.
During the last year HKT Trust and HKT grew its earnings per share (EPS) by 1.7%. This EPS growth is significantly lower than the 22% increase in the share price. This indicates that the market is now more optimistic about the stock.
The company's earnings per share (over time) is depicted in the image below (click to see the exact numbers).
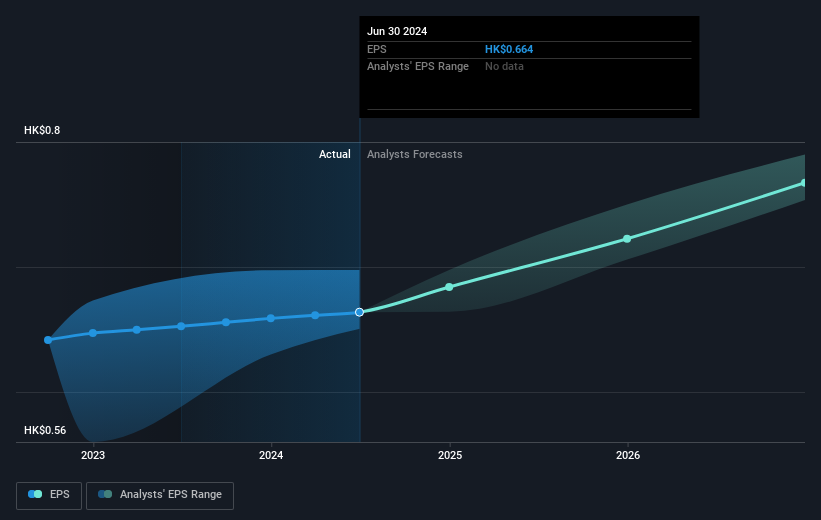
This free interactive report on HKT Trust and HKT's earnings, revenue and cash flow is a great place to start, if you want to investigate the stock further.
What About Dividends?
As well as measuring the share price return, investors should also consider the total shareholder return (TSR). Whereas the share price return only reflects the change in the share price, the TSR includes the value of dividends (assuming they were reinvested) and the benefit of any discounted capital raising or spin-off. Arguably, the TSR gives a more comprehensive picture of the return generated by a stock. As it happens, HKT Trust and HKT's TSR for the last 1 year was 33%, which exceeds the share price return mentioned earlier. This is largely a result of its dividend payments!
A Different Perspective
It's nice to see that HKT Trust and HKT shareholders have received a total shareholder return of 33% over the last year. That's including the dividend. That gain is better than the annual TSR over five years, which is 3%. Therefore it seems like sentiment around the company has been positive lately. Someone with an optimistic perspective could view the recent improvement in TSR as indicating that the business itself is getting better with time. It's always interesting to track share price performance over the longer term. But to understand HKT Trust and HKT better, we need to consider many other factors. Consider risks, for instance. Every company has them, and we've spotted 2 warning signs for HKT Trust and HKT you should know about.
If you like to buy stocks alongside management, then you might just love this free list of companies. (Hint: many of them are unnoticed AND have attractive valuation).
Please note, the market returns quoted in this article reflect the market weighted average returns of stocks that currently trade on Hong Kong exchanges.
Valuation is complex, but we're here to simplify it.
Discover if HKT Trust and HKT might be undervalued or overvalued with our detailed analysis, featuring fair value estimates, potential risks, dividends, insider trades, and its financial condition.
Access Free AnalysisHave feedback on this article? Concerned about the content? Get in touch with us directly. Alternatively, email editorial-team (at) simplywallst.com.
This article by Simply Wall St is general in nature. We provide commentary based on historical data and analyst forecasts only using an unbiased methodology and our articles are not intended to be financial advice. It does not constitute a recommendation to buy or sell any stock, and does not take account of your objectives, or your financial situation. We aim to bring you long-term focused analysis driven by fundamental data. Note that our analysis may not factor in the latest price-sensitive company announcements or qualitative material. Simply Wall St has no position in any stocks mentioned.
About SEHK:6823
HKT Trust and HKT
An investment holding company, engages in the provision of technology, and satellite-and network-based telecommunications and related services in Hong Kong, Mainland China, and internationally.
Average dividend payer and fair value.
Similar Companies
Market Insights

Advertisement
Community Narratives
MicroStrategy: Volatile Gamble or Golden Opportunity?
Fair Value US$663.00|31.9% undervalued
BL
Community Contributor
Emerging Markets and Debt Reduction Will Propel Bath & Body Works Forward
Fair Value US$40.73|22.1% undervalued
ZW
Community Contributor
An amazing opportunity to potentially get a 100 bagger
Fair Value US$10.00|36.0% overvalued
DA
Community Contributor