Investors Don't See Light At End Of Tongda Group Holdings Limited's (HKG:698) Tunnel And Push Stock Down 26%
Tongda Group Holdings Limited (HKG:698) shareholders won't be pleased to see that the share price has had a very rough month, dropping 26% and undoing the prior period's positive performance. Instead of being rewarded, shareholders who have already held through the last twelve months are now sitting on a 28% share price drop.
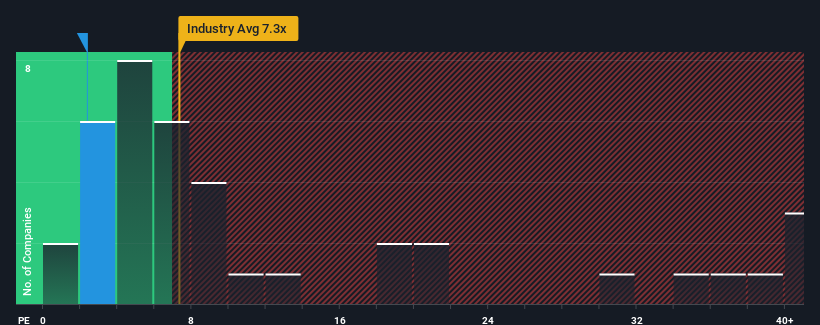
Even after such a large drop in price, given about half the companies in Hong Kong have price-to-earnings ratios (or "P/E's") above 10x, you may still consider Tongda Group Holdings as a highly attractive investment with its 2.4x P/E ratio. Although, it's not wise to just take the P/E at face value as there may be an explanation why it's so limited.
Recent times have been pleasing for Tongda Group Holdings as its earnings have risen in spite of the market's earnings going into reverse. One possibility is that the P/E is low because investors think the company's earnings are going to fall away like everyone else's soon. If not, then existing shareholders have reason to be quite optimistic about the future direction of the share price.
View our latest analysis for Tongda Group Holdings

What Are Growth Metrics Telling Us About The Low P/E?
Tongda Group Holdings' P/E ratio would be typical for a company that's expected to deliver very poor growth or even falling earnings, and importantly, perform much worse than the market.
If we review the last year of earnings growth, the company posted a terrific increase of 35%. The latest three year period has also seen an excellent 115% overall rise in EPS, aided by its short-term performance. Accordingly, shareholders would have probably welcomed those medium-term rates of earnings growth.
Looking ahead now, EPS is anticipated to slump, contracting by 8.8% per annum during the coming three years according to the one analyst following the company. Meanwhile, the broader market is forecast to expand by 16% each year, which paints a poor picture.
With this information, we are not surprised that Tongda Group Holdings is trading at a P/E lower than the market. Nonetheless, there's no guarantee the P/E has reached a floor yet with earnings going in reverse. Even just maintaining these prices could be difficult to achieve as the weak outlook is weighing down the shares.
The Key Takeaway
Tongda Group Holdings' P/E looks about as weak as its stock price lately. Typically, we'd caution against reading too much into price-to-earnings ratios when settling on investment decisions, though it can reveal plenty about what other market participants think about the company.
We've established that Tongda Group Holdings maintains its low P/E on the weakness of its forecast for sliding earnings, as expected. Right now shareholders are accepting the low P/E as they concede future earnings probably won't provide any pleasant surprises. It's hard to see the share price rising strongly in the near future under these circumstances.
Before you take the next step, you should know about the 3 warning signs for Tongda Group Holdings (1 is a bit unpleasant!) that we have uncovered.
If you're unsure about the strength of Tongda Group Holdings' business, why not explore our interactive list of stocks with solid business fundamentals for some other companies you may have missed.
The New Payments ETF Is Live on NASDAQ:
Money is moving to real-time rails, and a newly listed ETF now gives investors direct exposure. Fast settlement. Institutional custody. Simple access.
Explore how this launch could reshape portfolios
Sponsored ContentValuation is complex, but we're here to simplify it.
Discover if Tongda Group Holdings might be undervalued or overvalued with our detailed analysis, featuring fair value estimates, potential risks, dividends, insider trades, and its financial condition.
Access Free AnalysisHave feedback on this article? Concerned about the content? Get in touch with us directly. Alternatively, email editorial-team (at) simplywallst.com.
This article by Simply Wall St is general in nature. We provide commentary based on historical data and analyst forecasts only using an unbiased methodology and our articles are not intended to be financial advice. It does not constitute a recommendation to buy or sell any stock, and does not take account of your objectives, or your financial situation. We aim to bring you long-term focused analysis driven by fundamental data. Note that our analysis may not factor in the latest price-sensitive company announcements or qualitative material. Simply Wall St has no position in any stocks mentioned.
About SEHK:698
Tongda Group Holdings
An investment holding company, provides high-precision structural components for smart mobile communications and consumer electronic products.
Reasonable growth potential with adequate balance sheet.
Market Insights
Weekly Picks

THE KINGDOM OF BROWN GOODS: WHY MGPI IS BEING CRUSHED BY INVENTORY & PRIMED FOR RESURRECTION


Why Vertical Aerospace (NYSE: EVTL) is Worth Possibly Over 13x its Current Price


The Quiet Giant That Became AI’s Power Grid
Recently Updated Narratives


MINISO's fair value is projected at 26.69 with an anticipated PE ratio shift of 20x


Fiverr International will transform the freelance industry with AI-powered growth

Stride Stock: Online Education Finds Its Second Act
Popular Narratives


MicroVision will explode future revenue by 380.37% with a vision towards success


Crazy Undervalued 42 Baggers Silver Play (Active & Running Mine)


