- Hong Kong
- /
- Communications
- /
- SEHK:285
BYD Electronic (International)'s (HKG:285) five-year total shareholder returns outpace the underlying earnings growth


When you buy a stock there is always a possibility that it could drop 100%. But on the bright side, you can make far more than 100% on a really good stock. For instance, the price of BYD Electronic (International) Company Limited (HKG:285) stock is up an impressive 217% over the last five years. Unfortunately, though, the stock has dropped 8.2% over a week. But this could be related to the soft market, with stocks selling off around 3.0% in the last week.
Although BYD Electronic (International) has shed HK$6.8b from its market cap this week, let's take a look at its longer term fundamental trends and see if they've driven returns.
See our latest analysis for BYD Electronic (International)
While the efficient markets hypothesis continues to be taught by some, it has been proven that markets are over-reactive dynamic systems, and investors are not always rational. By comparing earnings per share (EPS) and share price changes over time, we can get a feel for how investor attitudes to a company have morphed over time.
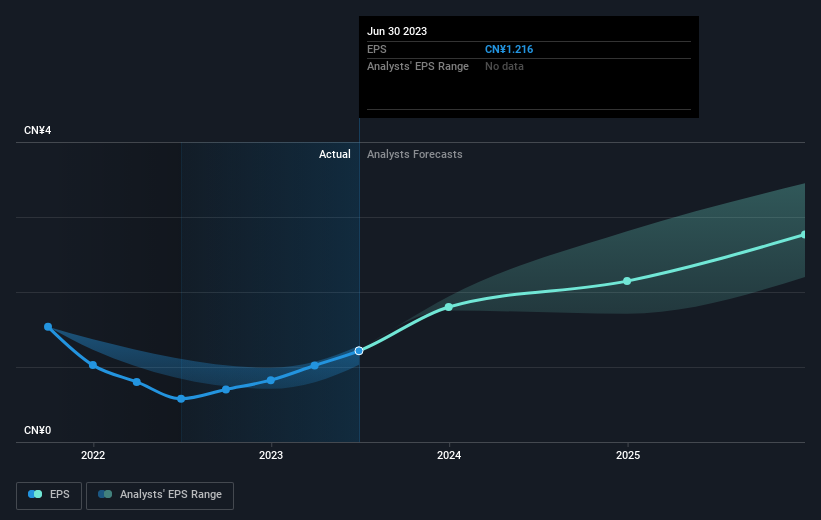
Over half a decade, BYD Electronic (International) managed to grow its earnings per share at 2.7% a year. This EPS growth is lower than the 26% average annual increase in the share price. This suggests that market participants hold the company in higher regard, these days. That's not necessarily surprising considering the five-year track record of earnings growth.
You can see below how EPS has changed over time (discover the exact values by clicking on the image).
We know that BYD Electronic (International) has improved its bottom line lately, but is it going to grow revenue? This free report showing analyst revenue forecasts should help you figure out if the EPS growth can be sustained.
What About Dividends?
It is important to consider the total shareholder return, as well as the share price return, for any given stock. The TSR incorporates the value of any spin-offs or discounted capital raisings, along with any dividends, based on the assumption that the dividends are reinvested. It's fair to say that the TSR gives a more complete picture for stocks that pay a dividend. In the case of BYD Electronic (International), it has a TSR of 231% for the last 5 years. That exceeds its share price return that we previously mentioned. This is largely a result of its dividend payments!
A Different Perspective
It's good to see that BYD Electronic (International) has rewarded shareholders with a total shareholder return of 34% in the last twelve months. And that does include the dividend. Since the one-year TSR is better than the five-year TSR (the latter coming in at 27% per year), it would seem that the stock's performance has improved in recent times. Given the share price momentum remains strong, it might be worth taking a closer look at the stock, lest you miss an opportunity. Before forming an opinion on BYD Electronic (International) you might want to consider these 3 valuation metrics.
Of course BYD Electronic (International) may not be the best stock to buy. So you may wish to see this free collection of growth stocks.
Please note, the market returns quoted in this article reflect the market weighted average returns of stocks that currently trade on Hong Kong exchanges.
Valuation is complex, but we're here to simplify it.
Discover if BYD Electronic (International) might be undervalued or overvalued with our detailed analysis, featuring fair value estimates, potential risks, dividends, insider trades, and its financial condition.
Access Free AnalysisHave feedback on this article? Concerned about the content? Get in touch with us directly. Alternatively, email editorial-team (at) simplywallst.com.
This article by Simply Wall St is general in nature. We provide commentary based on historical data and analyst forecasts only using an unbiased methodology and our articles are not intended to be financial advice. It does not constitute a recommendation to buy or sell any stock, and does not take account of your objectives, or your financial situation. We aim to bring you long-term focused analysis driven by fundamental data. Note that our analysis may not factor in the latest price-sensitive company announcements or qualitative material. Simply Wall St has no position in any stocks mentioned.
About SEHK:285
BYD Electronic (International)
An investment holding company, primarily engages in the design, manufacture, assembly, and sale of mobile handset components, modules, and other products in the People’s Republic of China and internationally.
Solid track record with excellent balance sheet.
Similar Companies
Market Insights

Community Narratives
