
Advertisement
- Hong Kong
- /
- Trade Distributors
- /
- SEHK:1094
Market Cool On Cherish Sunshine International Limited's (HKG:1094) Revenues Pushing Shares 33% Lower

Unfortunately for some shareholders, the Cherish Sunshine International Limited (HKG:1094) share price has dived 33% in the last thirty days, prolonging recent pain. Instead of being rewarded, shareholders who have already held through the last twelve months are now sitting on a 41% share price drop.
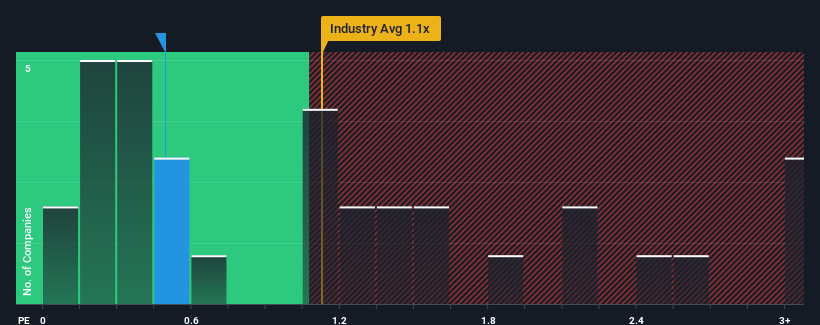
Although its price has dipped substantially, it would still be understandable if you think Cherish Sunshine International is a stock with good investment prospects with a price-to-sales ratios (or "P/S") of 0.5x, considering almost half the companies in Hong Kong's IT industry have P/S ratios above 1.1x. However, the P/S might be low for a reason and it requires further investigation to determine if it's justified.
Check out our latest analysis for Cherish Sunshine International
What Does Cherish Sunshine International's Recent Performance Look Like?
Recent times have been quite advantageous for Cherish Sunshine International as its revenue has been rising very briskly. One possibility is that the P/S ratio is low because investors think this strong revenue growth might actually underperform the broader industry in the near future. Those who are bullish on Cherish Sunshine International will be hoping that this isn't the case, so that they can pick up the stock at a lower valuation.
Although there are no analyst estimates available for Cherish Sunshine International, take a look at this free data-rich visualisation to see how the company stacks up on earnings, revenue and cash flow.Do Revenue Forecasts Match The Low P/S Ratio?
Cherish Sunshine International's P/S ratio would be typical for a company that's only expected to deliver limited growth, and importantly, perform worse than the industry.
If we review the last year of revenue growth, the company posted a terrific increase of 111%. This great performance means it was also able to deliver immense revenue growth over the last three years. Therefore, it's fair to say the revenue growth recently has been superb for the company.
Comparing that recent medium-term revenue trajectory with the industry's one-year growth forecast of 11% shows it's noticeably more attractive.
With this in mind, we find it intriguing that Cherish Sunshine International's P/S isn't as high compared to that of its industry peers. Apparently some shareholders believe the recent performance has exceeded its limits and have been accepting significantly lower selling prices.
The Bottom Line On Cherish Sunshine International's P/S
Cherish Sunshine International's P/S has taken a dip along with its share price. Using the price-to-sales ratio alone to determine if you should sell your stock isn't sensible, however it can be a practical guide to the company's future prospects.
Our examination of Cherish Sunshine International revealed its three-year revenue trends aren't boosting its P/S anywhere near as much as we would have predicted, given they look better than current industry expectations. When we see robust revenue growth that outpaces the industry, we presume that there are notable underlying risks to the company's future performance, which is exerting downward pressure on the P/S ratio. While recent revenue trends over the past medium-term suggest that the risk of a price decline is low, investors appear to perceive a likelihood of revenue fluctuations in the future.
We don't want to rain on the parade too much, but we did also find 3 warning signs for Cherish Sunshine International (2 are potentially serious!) that you need to be mindful of.
If companies with solid past earnings growth is up your alley, you may wish to see this free collection of other companies with strong earnings growth and low P/E ratios.
New: AI Stock Screener & Alerts
Our new AI Stock Screener scans the market every day to uncover opportunities.
• Dividend Powerhouses (3%+ Yield)
• Undervalued Small Caps with Insider Buying
• High growth Tech and AI Companies
Or build your own from over 50 metrics.
Have feedback on this article? Concerned about the content? Get in touch with us directly. Alternatively, email editorial-team (at) simplywallst.com.
This article by Simply Wall St is general in nature. We provide commentary based on historical data and analyst forecasts only using an unbiased methodology and our articles are not intended to be financial advice. It does not constitute a recommendation to buy or sell any stock, and does not take account of your objectives, or your financial situation. We aim to bring you long-term focused analysis driven by fundamental data. Note that our analysis may not factor in the latest price-sensitive company announcements or qualitative material. Simply Wall St has no position in any stocks mentioned.
About SEHK:1094
Cherish Sunshine International
An investment holding company, trades in various products in the People’s Republic of China.
Excellent balance sheet and good value.
Market Insights

Advertisement
Community Narratives
Scaling up in building materials with smart M&A and growing profitability
Fair Value US$2.77|29.6% undervalued
CM
Community Contributor
Hims: The Platform Powering Personalised Healthcare
Fair Value US$114.01|49.1% undervalued
BL
Community Contributor
Undervalued lottery company with strong fundamentals
Fair Value AU$15.00|35.4% undervalued
RO
Community Contributor
Proximus, transferring money from the impatient to the patient investor
Fair Value €16.62|54.5% undervalued
AX
Community Contributor