- Hong Kong
- /
- Real Estate
- /
- SEHK:12
Henderson Land Development Company Limited (HKG:12) Shares Could Be 35% Above Their Intrinsic Value Estimate


Key Insights
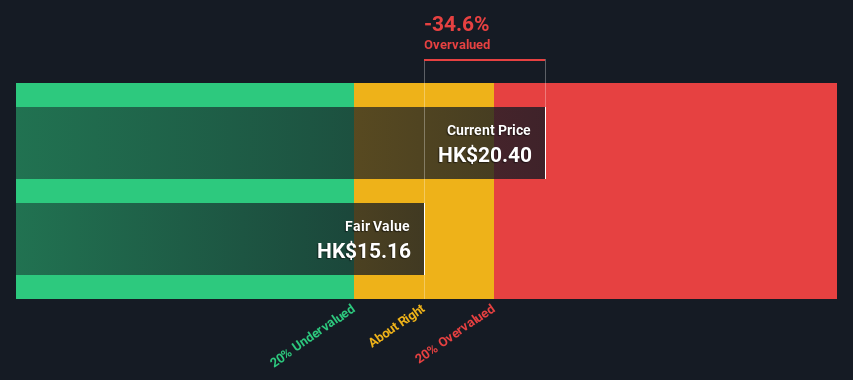
- Henderson Land Development's estimated fair value is HK$15.16 based on 2 Stage Free Cash Flow to Equity
- Henderson Land Development's HK$20.40 share price signals that it might be 35% overvalued
- Analyst price target for 12 is HK$23.56, which is 55% above our fair value estimate
Does the February share price for Henderson Land Development Company Limited (HKG:12) reflect what it's really worth? Today, we will estimate the stock's intrinsic value by estimating the company's future cash flows and discounting them to their present value. We will use the Discounted Cash Flow (DCF) model on this occasion. Models like these may appear beyond the comprehension of a lay person, but they're fairly easy to follow.
Companies can be valued in a lot of ways, so we would point out that a DCF is not perfect for every situation. If you want to learn more about discounted cash flow, the rationale behind this calculation can be read in detail in the Simply Wall St analysis model.
See our latest analysis for Henderson Land Development
Crunching The Numbers
We use what is known as a 2-stage model, which simply means we have two different periods of growth rates for the company's cash flows. Generally the first stage is higher growth, and the second stage is a lower growth phase. To start off with, we need to estimate the next ten years of cash flows. Where possible we use analyst estimates, but when these aren't available we extrapolate the previous free cash flow (FCF) from the last estimate or reported value. We assume companies with shrinking free cash flow will slow their rate of shrinkage, and that companies with growing free cash flow will see their growth rate slow, over this period. We do this to reflect that growth tends to slow more in the early years than it does in later years.
Generally we assume that a dollar today is more valuable than a dollar in the future, so we discount the value of these future cash flows to their estimated value in today's dollars:
10-year free cash flow (FCF) estimate
| 2024 | 2025 | 2026 | 2027 | 2028 | 2029 | 2030 | 2031 | 2032 | 2033 | |
| Levered FCF (HK$, Millions) | HK$19.9b | HK$13.4b | HK$10.1b | HK$8.39b | HK$7.46b | HK$6.92b | HK$6.62b | HK$6.45b | HK$6.38b | HK$6.36b |
| Growth Rate Estimate Source | Analyst x2 | Analyst x2 | Est @ -24.68% | Est @ -16.68% | Est @ -11.09% | Est @ -7.17% | Est @ -4.43% | Est @ -2.51% | Est @ -1.17% | Est @ -0.22% |
| Present Value (HK$, Millions) Discounted @ 13% | HK$17.6k | HK$10.4k | HK$6.9k | HK$5.1k | HK$4.0k | HK$3.3k | HK$2.8k | HK$2.4k | HK$2.1k | HK$1.8k |
("Est" = FCF growth rate estimated by Simply Wall St)
Present Value of 10-year Cash Flow (PVCF) = HK$57b
After calculating the present value of future cash flows in the initial 10-year period, we need to calculate the Terminal Value, which accounts for all future cash flows beyond the first stage. The Gordon Growth formula is used to calculate Terminal Value at a future annual growth rate equal to the 5-year average of the 10-year government bond yield of 2.0%. We discount the terminal cash flows to today's value at a cost of equity of 13%.
Terminal Value (TV)= FCF2033 × (1 + g) ÷ (r – g) = HK$6.4b× (1 + 2.0%) ÷ (13%– 2.0%) = HK$58b
Present Value of Terminal Value (PVTV)= TV / (1 + r)10= HK$58b÷ ( 1 + 13%)10= HK$17b
The total value is the sum of cash flows for the next ten years plus the discounted terminal value, which results in the Total Equity Value, which in this case is HK$73b. The last step is to then divide the equity value by the number of shares outstanding. Relative to the current share price of HK$20.4, the company appears potentially overvalued at the time of writing. Valuations are imprecise instruments though, rather like a telescope - move a few degrees and end up in a different galaxy. Do keep this in mind.
Important Assumptions
Now the most important inputs to a discounted cash flow are the discount rate, and of course, the actual cash flows. You don't have to agree with these inputs, I recommend redoing the calculations yourself and playing with them. The DCF also does not consider the possible cyclicality of an industry, or a company's future capital requirements, so it does not give a full picture of a company's potential performance. Given that we are looking at Henderson Land Development as potential shareholders, the cost of equity is used as the discount rate, rather than the cost of capital (or weighted average cost of capital, WACC) which accounts for debt. In this calculation we've used 13%, which is based on a levered beta of 1.893. Beta is a measure of a stock's volatility, compared to the market as a whole. We get our beta from the industry average beta of globally comparable companies, with an imposed limit between 0.8 and 2.0, which is a reasonable range for a stable business.
SWOT Analysis for Henderson Land Development
- Debt is well covered by earnings.
- Dividends are covered by earnings and cash flows.
- Dividend is in the top 25% of dividend payers in the market.
- Earnings declined over the past year.
- Expensive based on P/E ratio and estimated fair value.
- Annual earnings are forecast to grow for the next 4 years.
- Debt is not well covered by operating cash flow.
- Annual earnings are forecast to grow slower than the Hong Kong market.
Moving On:
Whilst important, the DCF calculation ideally won't be the sole piece of analysis you scrutinize for a company. The DCF model is not a perfect stock valuation tool. Preferably you'd apply different cases and assumptions and see how they would impact the company's valuation. If a company grows at a different rate, or if its cost of equity or risk free rate changes sharply, the output can look very different. What is the reason for the share price exceeding the intrinsic value? For Henderson Land Development, we've compiled three additional items you should further examine:
- Risks: Be aware that Henderson Land Development is showing 1 warning sign in our investment analysis , you should know about...
- Future Earnings: How does 12's growth rate compare to its peers and the wider market? Dig deeper into the analyst consensus number for the upcoming years by interacting with our free analyst growth expectation chart.
- Other High Quality Alternatives: Do you like a good all-rounder? Explore our interactive list of high quality stocks to get an idea of what else is out there you may be missing!
PS. The Simply Wall St app conducts a discounted cash flow valuation for every stock on the SEHK every day. If you want to find the calculation for other stocks just search here.
Valuation is complex, but we're here to simplify it.
Discover if Henderson Land Development might be undervalued or overvalued with our detailed analysis, featuring fair value estimates, potential risks, dividends, insider trades, and its financial condition.
Access Free AnalysisHave feedback on this article? Concerned about the content? Get in touch with us directly. Alternatively, email editorial-team (at) simplywallst.com.
This article by Simply Wall St is general in nature. We provide commentary based on historical data and analyst forecasts only using an unbiased methodology and our articles are not intended to be financial advice. It does not constitute a recommendation to buy or sell any stock, and does not take account of your objectives, or your financial situation. We aim to bring you long-term focused analysis driven by fundamental data. Note that our analysis may not factor in the latest price-sensitive company announcements or qualitative material. Simply Wall St has no position in any stocks mentioned.
About SEHK:12
Henderson Land Development
An investment holding company, engages in the property development and investment activities in Hong Kong and Mainland China.
Established dividend payer low.
