Insufficient Growth At Shandong Xinhua Pharmaceutical Company Limited (HKG:719) Hampers Share Price


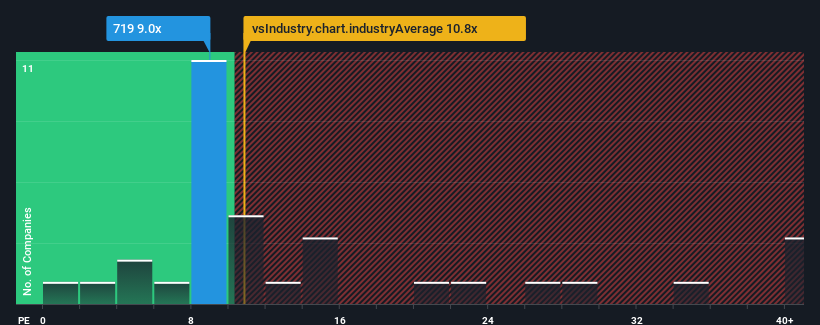
Shandong Xinhua Pharmaceutical Company Limited's (HKG:719) price-to-earnings (or "P/E") ratio of 9x might make it look like a buy right now compared to the market in Hong Kong, where around half of the companies have P/E ratios above 11x and even P/E's above 23x are quite common. However, the P/E might be low for a reason and it requires further investigation to determine if it's justified.
We've discovered 1 warning sign about Shandong Xinhua Pharmaceutical. View them for free.As an illustration, earnings have deteriorated at Shandong Xinhua Pharmaceutical over the last year, which is not ideal at all. It might be that many expect the disappointing earnings performance to continue or accelerate, which has repressed the P/E. However, if this doesn't eventuate then existing shareholders may be feeling optimistic about the future direction of the share price.
Check out our latest analysis for Shandong Xinhua Pharmaceutical
How Is Shandong Xinhua Pharmaceutical's Growth Trending?
Shandong Xinhua Pharmaceutical's P/E ratio would be typical for a company that's only expected to deliver limited growth, and importantly, perform worse than the market.
Taking a look back first, the company's earnings per share growth last year wasn't something to get excited about as it posted a disappointing decline of 12%. That put a dampener on the good run it was having over the longer-term as its three-year EPS growth is still a noteworthy 13% in total. So we can start by confirming that the company has generally done a good job of growing earnings over that time, even though it had some hiccups along the way.
Comparing that to the market, which is predicted to deliver 18% growth in the next 12 months, the company's momentum is weaker based on recent medium-term annualised earnings results.
With this information, we can see why Shandong Xinhua Pharmaceutical is trading at a P/E lower than the market. Apparently many shareholders weren't comfortable holding on to something they believe will continue to trail the bourse.
The Key Takeaway
We'd say the price-to-earnings ratio's power isn't primarily as a valuation instrument but rather to gauge current investor sentiment and future expectations.
We've established that Shandong Xinhua Pharmaceutical maintains its low P/E on the weakness of its recent three-year growth being lower than the wider market forecast, as expected. Right now shareholders are accepting the low P/E as they concede future earnings probably won't provide any pleasant surprises. If recent medium-term earnings trends continue, it's hard to see the share price rising strongly in the near future under these circumstances.
We don't want to rain on the parade too much, but we did also find 1 warning sign for Shandong Xinhua Pharmaceutical that you need to be mindful of.
Of course, you might also be able to find a better stock than Shandong Xinhua Pharmaceutical. So you may wish to see this free collection of other companies that have reasonable P/E ratios and have grown earnings strongly.
If you're looking to trade Shandong Xinhua Pharmaceutical, open an account with the lowest-cost platform trusted by professionals, Interactive Brokers.
With clients in over 200 countries and territories, and access to 160 markets, IBKR lets you trade stocks, options, futures, forex, bonds and funds from a single integrated account.
Enjoy no hidden fees, no account minimums, and FX conversion rates as low as 0.03%, far better than what most brokers offer.
Sponsored ContentNew: Manage All Your Stock Portfolios in One Place
We've created the ultimate portfolio companion for stock investors, and it's free.
• Connect an unlimited number of Portfolios and see your total in one currency
• Be alerted to new Warning Signs or Risks via email or mobile
• Track the Fair Value of your stocks
Have feedback on this article? Concerned about the content? Get in touch with us directly. Alternatively, email editorial-team (at) simplywallst.com.
This article by Simply Wall St is general in nature. We provide commentary based on historical data and analyst forecasts only using an unbiased methodology and our articles are not intended to be financial advice. It does not constitute a recommendation to buy or sell any stock, and does not take account of your objectives, or your financial situation. We aim to bring you long-term focused analysis driven by fundamental data. Note that our analysis may not factor in the latest price-sensitive company announcements or qualitative material. Simply Wall St has no position in any stocks mentioned.
About SEHK:719
Shandong Xinhua Pharmaceutical
Develops, manufactures, and sells bulk pharmaceuticals, preparations, and chemical products in the People’s Republic of China, the Americas, Europe, and internationally.
Flawless balance sheet second-rate dividend payer.
Similar Companies
Market Insights

Community Narratives


