
The external fund manager backed by Berkshire Hathaway's Charlie Munger, Li Lu, makes no bones about it when he says 'The biggest investment risk is not the volatility of prices, but whether you will suffer a permanent loss of capital.' So it might be obvious that you need to consider debt, when you think about how risky any given stock is, because too much debt can sink a company. We can see that Greenheart Group Limited (HKG:94) does use debt in its business. But should shareholders be worried about its use of debt?
What Risk Does Debt Bring?
Debt is a tool to help businesses grow, but if a business is incapable of paying off its lenders, then it exists at their mercy. Ultimately, if the company can't fulfill its legal obligations to repay debt, shareholders could walk away with nothing. However, a more usual (but still expensive) situation is where a company must dilute shareholders at a cheap share price simply to get debt under control. By replacing dilution, though, debt can be an extremely good tool for businesses that need capital to invest in growth at high rates of return. The first thing to do when considering how much debt a business uses is to look at its cash and debt together.
See our latest analysis for Greenheart Group
What Is Greenheart Group's Net Debt?
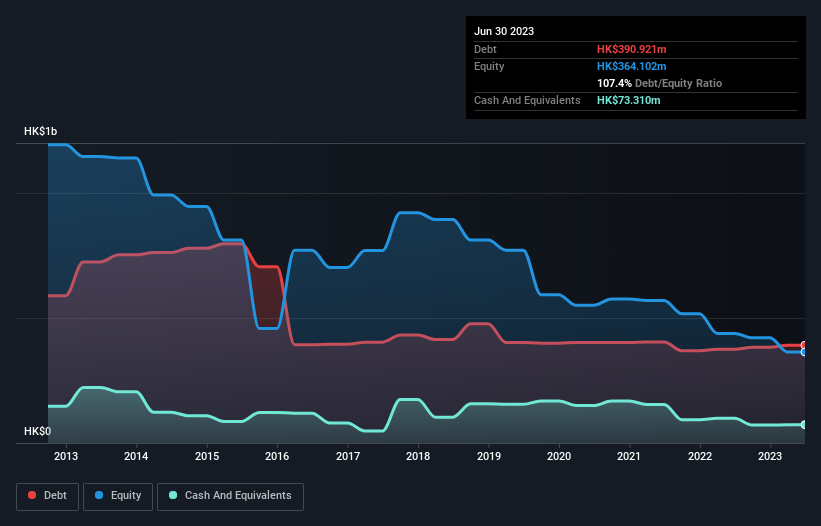
As you can see below, at the end of June 2023, Greenheart Group had HK$390.9m of debt, up from HK$374.6m a year ago. Click the image for more detail. However, because it has a cash reserve of HK$73.3m, its net debt is less, at about HK$317.6m.
How Healthy Is Greenheart Group's Balance Sheet?
We can see from the most recent balance sheet that Greenheart Group had liabilities of HK$66.4m falling due within a year, and liabilities of HK$482.9m due beyond that. On the other hand, it had cash of HK$73.3m and HK$26.2m worth of receivables due within a year. So it has liabilities totalling HK$449.8m more than its cash and near-term receivables, combined.
This deficit casts a shadow over the HK$92.7m company, like a colossus towering over mere mortals. So we'd watch its balance sheet closely, without a doubt. After all, Greenheart Group would likely require a major re-capitalisation if it had to pay its creditors today. There's no doubt that we learn most about debt from the balance sheet. But it is Greenheart Group's earnings that will influence how the balance sheet holds up in the future. So when considering debt, it's definitely worth looking at the earnings trend. Click here for an interactive snapshot.
Over 12 months, Greenheart Group made a loss at the EBIT level, and saw its revenue drop to HK$120m, which is a fall of 55%. That makes us nervous, to say the least.
Caveat Emptor
While Greenheart Group's falling revenue is about as heartwarming as a wet blanket, arguably its earnings before interest and tax (EBIT) loss is even less appealing. Its EBIT loss was a whopping HK$136m. If you consider the significant liabilities mentioned above, we are extremely wary of this investment. That said, it is possible that the company will turn its fortunes around. Nevertheless, we would not bet on it given that it vaporized HK$36m in cash over the last twelve months, and it doesn't have much by way of liquid assets. So we consider this a high risk stock and we wouldn't be at all surprised if the company asks shareholders for money before long. When analysing debt levels, the balance sheet is the obvious place to start. However, not all investment risk resides within the balance sheet - far from it. For instance, we've identified 3 warning signs for Greenheart Group (1 is concerning) you should be aware of.
Of course, if you're the type of investor who prefers buying stocks without the burden of debt, then don't hesitate to discover our exclusive list of net cash growth stocks, today.
The New Payments ETF Is Live on NASDAQ:
Money is moving to real-time rails, and a newly listed ETF now gives investors direct exposure. Fast settlement. Institutional custody. Simple access.
Explore how this launch could reshape portfolios
Sponsored ContentNew: Manage All Your Stock Portfolios in One Place
We've created the ultimate portfolio companion for stock investors, and it's free.
• Connect an unlimited number of Portfolios and see your total in one currency
• Be alerted to new Warning Signs or Risks via email or mobile
• Track the Fair Value of your stocks
Have feedback on this article? Concerned about the content? Get in touch with us directly. Alternatively, email editorial-team (at) simplywallst.com.
This article by Simply Wall St is general in nature. We provide commentary based on historical data and analyst forecasts only using an unbiased methodology and our articles are not intended to be financial advice. It does not constitute a recommendation to buy or sell any stock, and does not take account of your objectives, or your financial situation. We aim to bring you long-term focused analysis driven by fundamental data. Note that our analysis may not factor in the latest price-sensitive company announcements or qualitative material. Simply Wall St has no position in any stocks mentioned.
About SEHK:94
Greenheart Group
An investment holding company, engages in forestry business worldwide.
Low risk with imperfect balance sheet.
Market Insights

Weekly Picks

THE KINGDOM OF BROWN GOODS: WHY MGPI IS BEING CRUSHED BY INVENTORY & PRIMED FOR RESURRECTION


Why Vertical Aerospace (NYSE: EVTL) is Worth Possibly Over 13x its Current Price


The Quiet Giant That Became AI’s Power Grid
Recently Updated Narratives


MINISO's fair value is projected at 26.69 with an anticipated PE ratio shift of 20x

Fiverr International will transform the freelance industry with AI-powered growth

Stride Stock: Online Education Finds Its Second Act
Popular Narratives


MicroVision will explode future revenue by 380.37% with a vision towards success


Crazy Undervalued 42 Baggers Silver Play (Active & Running Mine)


