- Hong Kong
- /
- Basic Materials
- /
- SEHK:58
Sunway International Holdings Full Year 2024 Earnings: HK$0.31 loss per share (vs HK$0.25 loss in FY 2023)


Sunway International Holdings (HKG:58) Full Year 2024 Results
Key Financial Results
- Revenue: HK$256.4m (up 4.0% from FY 2023).
- Net loss: HK$56.1m (loss widened by 24% from FY 2023).
- HK$0.31 loss per share (further deteriorated from HK$0.25 loss in FY 2023).
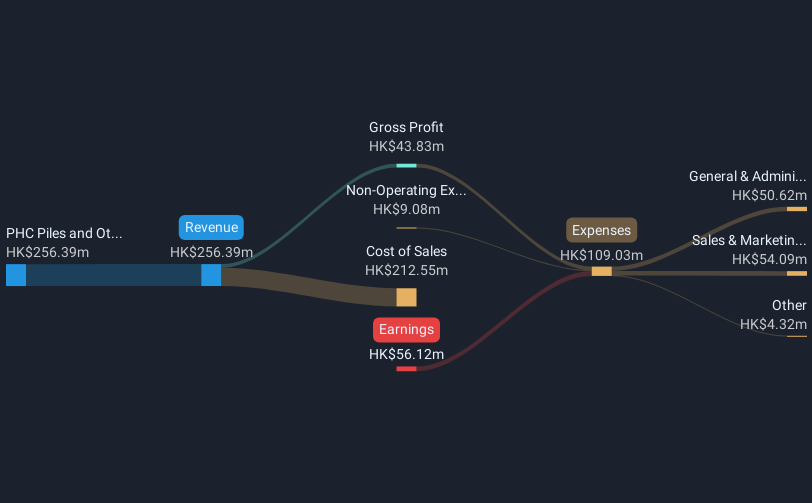
All figures shown in the chart above are for the trailing 12 month (TTM) period
In the last 12 months, the only revenue segment was PHC Piles and Others contributing HK$256.4m. Notably, cost of sales worth HK$212.6m amounted to 83% of total revenue thereby underscoring the impact on earnings. The largest operating expense was Sales & Marketing costs, amounting to HK$54.1m (50% of total expenses). Over the last 12 months, the company's earnings were enhanced by non-operating gains of HK$9.08m. Explore how 58's revenue and expenses shape its earnings.
Sunway International Holdings shares are down 14% from a week ago.
Risk Analysis
You should learn about the 3 warning signs we've spotted with Sunway International Holdings (including 2 which are a bit concerning).
If you're looking to trade Sunway International Holdings, open an account with the lowest-cost platform trusted by professionals, Interactive Brokers.
With clients in over 200 countries and territories, and access to 160 markets, IBKR lets you trade stocks, options, futures, forex, bonds and funds from a single integrated account.
Enjoy no hidden fees, no account minimums, and FX conversion rates as low as 0.03%, far better than what most brokers offer.
Sponsored ContentNew: Manage All Your Stock Portfolios in One Place
We've created the ultimate portfolio companion for stock investors, and it's free.
• Connect an unlimited number of Portfolios and see your total in one currency
• Be alerted to new Warning Signs or Risks via email or mobile
• Track the Fair Value of your stocks
Have feedback on this article? Concerned about the content? Get in touch with us directly. Alternatively, email editorial-team (at) simplywallst.com.
This article by Simply Wall St is general in nature. We provide commentary based on historical data and analyst forecasts only using an unbiased methodology and our articles are not intended to be financial advice. It does not constitute a recommendation to buy or sell any stock, and does not take account of your objectives, or your financial situation. We aim to bring you long-term focused analysis driven by fundamental data. Note that our analysis may not factor in the latest price-sensitive company announcements or qualitative material. Simply Wall St has no position in any stocks mentioned.
About SEHK:58
Sunway International Holdings
An investment holding company, engages in the manufacture and sale of construction materials in the People’s Republic of China.
Low and slightly overvalued.
Market Insights

Community Narratives
