
Advertisement
- Hong Kong
- /
- Metals and Mining
- /
- SEHK:486
United Company RUSAL International (HKG:486) shareholders have endured a 54% loss from investing in the stock three years ago
If you love investing in stocks you're bound to buy some losers. Long term United Company RUSAL, International Public Joint-Stock Company (HKG:486) shareholders know that all too well, since the share price is down considerably over three years. Unfortunately, they have held through a 56% decline in the share price in that time. Furthermore, it's down 13% in about a quarter. That's not much fun for holders. Of course, this share price action may well have been influenced by the 8.6% decline in the broader market, throughout the period.
So let's have a look and see if the longer term performance of the company has been in line with the underlying business' progress.
See our latest analysis for United Company RUSAL International
There is no denying that markets are sometimes efficient, but prices do not always reflect underlying business performance. One imperfect but simple way to consider how the market perception of a company has shifted is to compare the change in the earnings per share (EPS) with the share price movement.
United Company RUSAL International saw its EPS decline at a compound rate of 28% per year, over the last three years. This fall in EPS isn't far from the rate of share price decline, which was 24% per year. So it seems like sentiment towards the stock hasn't changed all that much over time. Rather, the share price has approximately tracked EPS growth.
The image below shows how EPS has tracked over time (if you click on the image you can see greater detail).
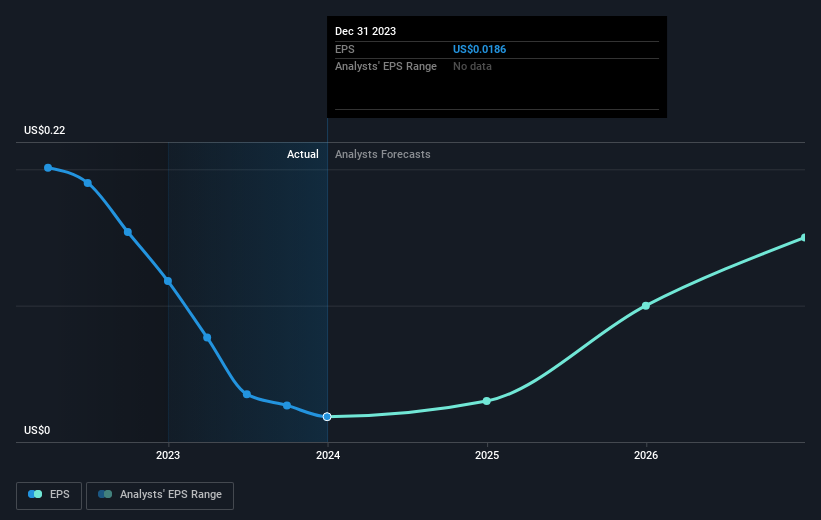
It might be well worthwhile taking a look at our free report on United Company RUSAL International's earnings, revenue and cash flow.
What About The Total Shareholder Return (TSR)?
Investors should note that there's a difference between United Company RUSAL International's total shareholder return (TSR) and its share price change, which we've covered above. Arguably the TSR is a more complete return calculation because it accounts for the value of dividends (as if they were reinvested), along with the hypothetical value of any discounted capital that have been offered to shareholders. United Company RUSAL International's TSR of was a loss of 54% for the 3 years. That wasn't as bad as its share price return, because it has paid dividends.
A Different Perspective
United Company RUSAL International shareholders are down 9.3% for the year, but the market itself is up 8.9%. Even the share prices of good stocks drop sometimes, but we want to see improvements in the fundamental metrics of a business, before getting too interested. Unfortunately, last year's performance may indicate unresolved challenges, given that it was worse than the annualised loss of 4% over the last half decade. Generally speaking long term share price weakness can be a bad sign, though contrarian investors might want to research the stock in hope of a turnaround. While it is well worth considering the different impacts that market conditions can have on the share price, there are other factors that are even more important. Consider for instance, the ever-present spectre of investment risk. We've identified 3 warning signs with United Company RUSAL International (at least 1 which is a bit concerning) , and understanding them should be part of your investment process.
If you are like me, then you will not want to miss this free list of undervalued small caps that insiders are buying.
Please note, the market returns quoted in this article reflect the market weighted average returns of stocks that currently trade on Hong Kong exchanges.
New: AI Stock Screener & Alerts
Our new AI Stock Screener scans the market every day to uncover opportunities.
• Dividend Powerhouses (3%+ Yield)
• Undervalued Small Caps with Insider Buying
• High growth Tech and AI Companies
Or build your own from over 50 metrics.
Have feedback on this article? Concerned about the content? Get in touch with us directly. Alternatively, email editorial-team (at) simplywallst.com.
This article by Simply Wall St is general in nature. We provide commentary based on historical data and analyst forecasts only using an unbiased methodology and our articles are not intended to be financial advice. It does not constitute a recommendation to buy or sell any stock, and does not take account of your objectives, or your financial situation. We aim to bring you long-term focused analysis driven by fundamental data. Note that our analysis may not factor in the latest price-sensitive company announcements or qualitative material. Simply Wall St has no position in any stocks mentioned.
About SEHK:486
United Company RUSAL International
Engages in production and trading of aluminium and related products in Russia.
Adequate balance sheet slight.
Similar Companies
Market Insights


Advertisement
Community Narratives
Nike's Direct-to-Consumer Focus Will Drive Future Growth
Fair Value US$87.90|18.2% undervalued
UN
Community Contributor
Novo Nordisk will dominate GLP-1 market with Ozempic and Wegovy growth
Fair Value US$89.59|12.1% undervalued
BE
Community Contributor
Rheinmetall could get 20-25% of EU-NATO 3%-GDP defence spending
Fair Value €7.57k|82.4% undervalued
NO
Community Contributor