Investors Give ZhongAn Online P & C Insurance Co., Ltd. (HKG:6060) Shares A 25% Hiding


Unfortunately for some shareholders, the ZhongAn Online P & C Insurance Co., Ltd. (HKG:6060) share price has dived 25% in the last thirty days, prolonging recent pain. Instead of being rewarded, shareholders who have already held through the last twelve months are now sitting on a 47% share price drop.
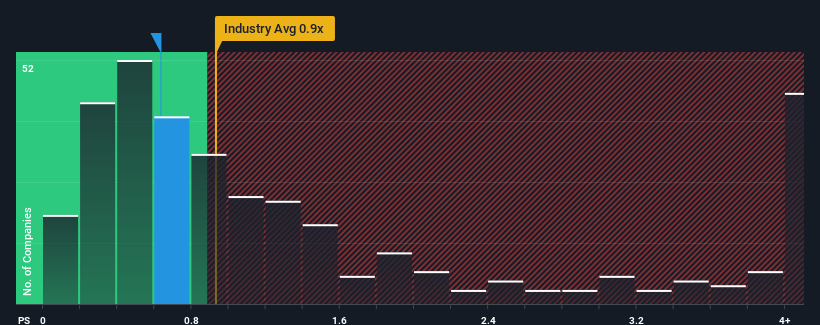
Even after such a large drop in price, it's still not a stretch to say that ZhongAn Online P & C Insurance's price-to-sales (or "P/S") ratio of 0.6x right now seems quite "middle-of-the-road" compared to the Insurance industry in Hong Kong, where the median P/S ratio is around 0.3x. However, investors might be overlooking a clear opportunity or potential setback if there is no rational basis for the P/S.
See our latest analysis for ZhongAn Online P & C Insurance
What Does ZhongAn Online P & C Insurance's Recent Performance Look Like?
With its revenue growth in positive territory compared to the declining revenue of most other companies, ZhongAn Online P & C Insurance has been doing quite well of late. Perhaps the market is expecting its current strong performance to taper off in accordance to the rest of the industry, which has kept the P/S contained. If not, then existing shareholders have reason to be feeling optimistic about the future direction of the share price.
Keen to find out how analysts think ZhongAn Online P & C Insurance's future stacks up against the industry? In that case, our free report is a great place to start.What Are Revenue Growth Metrics Telling Us About The P/S?
ZhongAn Online P & C Insurance's P/S ratio would be typical for a company that's only expected to deliver moderate growth, and importantly, perform in line with the industry.
Retrospectively, the last year delivered a decent 14% gain to the company's revenues. Pleasingly, revenue has also lifted 59% in aggregate from three years ago, partly thanks to the last 12 months of growth. Therefore, it's fair to say the revenue growth recently has been superb for the company.
Turning to the outlook, the next three years should generate growth of 17% per year as estimated by the analysts watching the company. With the industry only predicted to deliver 13% per annum, the company is positioned for a stronger revenue result.
In light of this, it's curious that ZhongAn Online P & C Insurance's P/S sits in line with the majority of other companies. Apparently some shareholders are skeptical of the forecasts and have been accepting lower selling prices.
The Bottom Line On ZhongAn Online P & C Insurance's P/S
With its share price dropping off a cliff, the P/S for ZhongAn Online P & C Insurance looks to be in line with the rest of the Insurance industry. While the price-to-sales ratio shouldn't be the defining factor in whether you buy a stock or not, it's quite a capable barometer of revenue expectations.
Despite enticing revenue growth figures that outpace the industry, ZhongAn Online P & C Insurance's P/S isn't quite what we'd expect. There could be some risks that the market is pricing in, which is preventing the P/S ratio from matching the positive outlook. This uncertainty seems to be reflected in the share price which, while stable, could be higher given the revenue forecasts.
A lot of potential risks can sit within a company's balance sheet. Take a look at our free balance sheet analysis for ZhongAn Online P & C Insurance with six simple checks on some of these key factors.
If these risks are making you reconsider your opinion on ZhongAn Online P & C Insurance, explore our interactive list of high quality stocks to get an idea of what else is out there.
Valuation is complex, but we're here to simplify it.
Discover if ZhongAn Online P & C Insurance might be undervalued or overvalued with our detailed analysis, featuring fair value estimates, potential risks, dividends, insider trades, and its financial condition.
Access Free AnalysisHave feedback on this article? Concerned about the content? Get in touch with us directly. Alternatively, email editorial-team (at) simplywallst.com.
This article by Simply Wall St is general in nature. We provide commentary based on historical data and analyst forecasts only using an unbiased methodology and our articles are not intended to be financial advice. It does not constitute a recommendation to buy or sell any stock, and does not take account of your objectives, or your financial situation. We aim to bring you long-term focused analysis driven by fundamental data. Note that our analysis may not factor in the latest price-sensitive company announcements or qualitative material. Simply Wall St has no position in any stocks mentioned.
About SEHK:6060
ZhongAn Online P & C Insurance
An Internet-based Insurtech company, provides internet insurance and insurance information technology services in the People’s Republic of China.
Adequate balance sheet with moderate growth potential.
Market Insights

Community Narratives


