- Hong Kong
- /
- Household Products
- /
- SEHK:6993
Blue Moon Group Holdings Limited (HKG:6993) Stocks Shoot Up 30% But Its P/S Still Looks Reasonable

Despite an already strong run, Blue Moon Group Holdings Limited (HKG:6993) shares have been powering on, with a gain of 30% in the last thirty days. The last 30 days bring the annual gain to a very sharp 85%.
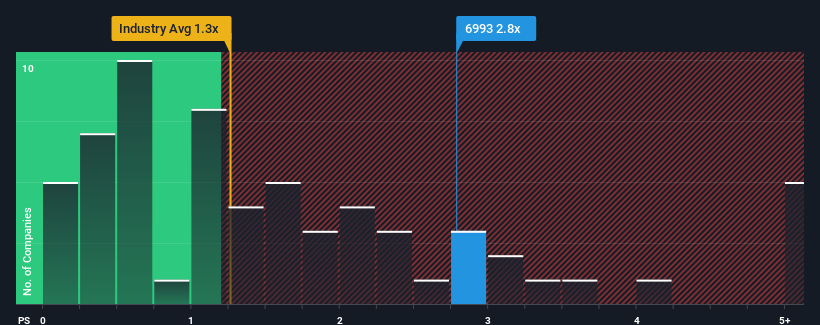
Following the firm bounce in price, when almost half of the companies in Hong Kong's Household Products industry have price-to-sales ratios (or "P/S") below 0.5x, you may consider Blue Moon Group Holdings as a stock not worth researching with its 2.8x P/S ratio. Although, it's not wise to just take the P/S at face value as there may be an explanation why it's so lofty.
Check out our latest analysis for Blue Moon Group Holdings

What Does Blue Moon Group Holdings' Recent Performance Look Like?
Recent revenue growth for Blue Moon Group Holdings has been in line with the industry. Perhaps the market is expecting future revenue performance to improve, justifying the currently elevated P/S. You'd really hope so, otherwise you're paying a pretty hefty price for no particular reason.
If you'd like to see what analysts are forecasting going forward, you should check out our free report on Blue Moon Group Holdings.Do Revenue Forecasts Match The High P/S Ratio?
The only time you'd be truly comfortable seeing a P/S as steep as Blue Moon Group Holdings' is when the company's growth is on track to outshine the industry decidedly.
Retrospectively, the last year delivered a decent 13% gain to the company's revenues. The latest three year period has also seen a 19% overall rise in revenue, aided somewhat by its short-term performance. Therefore, it's fair to say the revenue growth recently has been respectable for the company.
Looking ahead now, revenue is anticipated to climb by 9.8% per annum during the coming three years according to the four analysts following the company. With the industry only predicted to deliver 6.0% each year, the company is positioned for a stronger revenue result.
With this information, we can see why Blue Moon Group Holdings is trading at such a high P/S compared to the industry. Apparently shareholders aren't keen to offload something that is potentially eyeing a more prosperous future.
What Does Blue Moon Group Holdings' P/S Mean For Investors?
Shares in Blue Moon Group Holdings have seen a strong upwards swing lately, which has really helped boost its P/S figure. It's argued the price-to-sales ratio is an inferior measure of value within certain industries, but it can be a powerful business sentiment indicator.
Our look into Blue Moon Group Holdings shows that its P/S ratio remains high on the merit of its strong future revenues. At this stage investors feel the potential for a deterioration in revenues is quite remote, justifying the elevated P/S ratio. Unless the analysts have really missed the mark, these strong revenue forecasts should keep the share price buoyant.
The company's balance sheet is another key area for risk analysis. Take a look at our free balance sheet analysis for Blue Moon Group Holdings with six simple checks on some of these key factors.
If these risks are making you reconsider your opinion on Blue Moon Group Holdings, explore our interactive list of high quality stocks to get an idea of what else is out there.
If you're looking to trade Blue Moon Group Holdings, open an account with the lowest-cost platform trusted by professionals, Interactive Brokers.
With clients in over 200 countries and territories, and access to 160 markets, IBKR lets you trade stocks, options, futures, forex, bonds and funds from a single integrated account.
Enjoy no hidden fees, no account minimums, and FX conversion rates as low as 0.03%, far better than what most brokers offer.
Sponsored ContentValuation is complex, but we're here to simplify it.
Discover if Blue Moon Group Holdings might be undervalued or overvalued with our detailed analysis, featuring fair value estimates, potential risks, dividends, insider trades, and its financial condition.
Access Free AnalysisHave feedback on this article? Concerned about the content? Get in touch with us directly. Alternatively, email editorial-team (at) simplywallst.com.
This article by Simply Wall St is general in nature. We provide commentary based on historical data and analyst forecasts only using an unbiased methodology and our articles are not intended to be financial advice. It does not constitute a recommendation to buy or sell any stock, and does not take account of your objectives, or your financial situation. We aim to bring you long-term focused analysis driven by fundamental data. Note that our analysis may not factor in the latest price-sensitive company announcements or qualitative material. Simply Wall St has no position in any stocks mentioned.
About SEHK:6993
Blue Moon Group Holdings
Engages in the research, design, development, manufacture, and sale of personal hygiene, home care, and fabric care products in China.
Flawless balance sheet with moderate growth potential.
Market Insights
Community Narratives


