- Hong Kong
- /
- Personal Products
- /
- SEHK:3332
What Nanjing Sinolife United Company Limited's (HKG:3332) 62% Share Price Gain Is Not Telling You


Nanjing Sinolife United Company Limited (HKG:3332) shares have continued their recent momentum with a 62% gain in the last month alone. The last month tops off a massive increase of 199% in the last year.
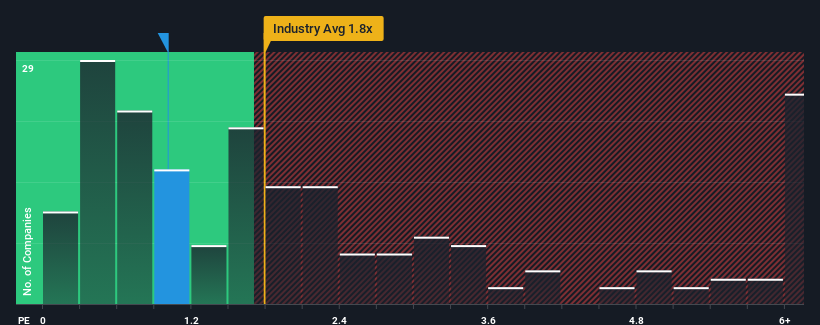
In spite of the firm bounce in price, it's still not a stretch to say that Nanjing Sinolife United's price-to-sales (or "P/S") ratio of 1x right now seems quite "middle-of-the-road" compared to the Personal Products industry in Hong Kong, where the median P/S ratio is around 0.8x. Although, it's not wise to simply ignore the P/S without explanation as investors may be disregarding a distinct opportunity or a costly mistake.
View our latest analysis for Nanjing Sinolife United
What Does Nanjing Sinolife United's P/S Mean For Shareholders?
Nanjing Sinolife United certainly has been doing a great job lately as it's been growing its revenue at a really rapid pace. It might be that many expect the strong revenue performance to wane, which has kept the share price, and thus the P/S ratio, from rising. If that doesn't eventuate, then existing shareholders have reason to be feeling optimistic about the future direction of the share price.
Want the full picture on earnings, revenue and cash flow for the company? Then our free report on Nanjing Sinolife United will help you shine a light on its historical performance.What Are Revenue Growth Metrics Telling Us About The P/S?
In order to justify its P/S ratio, Nanjing Sinolife United would need to produce growth that's similar to the industry.
Taking a look back first, we see that the company grew revenue by an impressive 48% last year. Revenue has also lifted 22% in aggregate from three years ago, mostly thanks to the last 12 months of growth. Accordingly, shareholders would have probably been satisfied with the medium-term rates of revenue growth.
Comparing the recent medium-term revenue trends against the industry's one-year growth forecast of 9.9% shows it's noticeably less attractive.
With this information, we find it interesting that Nanjing Sinolife United is trading at a fairly similar P/S compared to the industry. It seems most investors are ignoring the fairly limited recent growth rates and are willing to pay up for exposure to the stock. Maintaining these prices will be difficult to achieve as a continuation of recent revenue trends is likely to weigh down the shares eventually.
The Key Takeaway
Nanjing Sinolife United's stock has a lot of momentum behind it lately, which has brought its P/S level with the rest of the industry. It's argued the price-to-sales ratio is an inferior measure of value within certain industries, but it can be a powerful business sentiment indicator.
We've established that Nanjing Sinolife United's average P/S is a bit surprising since its recent three-year growth is lower than the wider industry forecast. Right now we are uncomfortable with the P/S as this revenue performance isn't likely to support a more positive sentiment for long. Unless there is a significant improvement in the company's medium-term performance, it will be difficult to prevent the P/S ratio from declining to a more reasonable level.
We don't want to rain on the parade too much, but we did also find 2 warning signs for Nanjing Sinolife United (1 doesn't sit too well with us!) that you need to be mindful of.
If companies with solid past earnings growth is up your alley, you may wish to see this free collection of other companies with strong earnings growth and low P/E ratios.
If you're looking to trade Nanjing Sinolife United, open an account with the lowest-cost platform trusted by professionals, Interactive Brokers.
With clients in over 200 countries and territories, and access to 160 markets, IBKR lets you trade stocks, options, futures, forex, bonds and funds from a single integrated account.
Enjoy no hidden fees, no account minimums, and FX conversion rates as low as 0.03%, far better than what most brokers offer.
Sponsored ContentValuation is complex, but we're here to simplify it.
Discover if Nanjing Sinolife United might be undervalued or overvalued with our detailed analysis, featuring fair value estimates, potential risks, dividends, insider trades, and its financial condition.
Access Free AnalysisHave feedback on this article? Concerned about the content? Get in touch with us directly. Alternatively, email editorial-team (at) simplywallst.com.
This article by Simply Wall St is general in nature. We provide commentary based on historical data and analyst forecasts only using an unbiased methodology and our articles are not intended to be financial advice. It does not constitute a recommendation to buy or sell any stock, and does not take account of your objectives, or your financial situation. We aim to bring you long-term focused analysis driven by fundamental data. Note that our analysis may not factor in the latest price-sensitive company announcements or qualitative material. Simply Wall St has no position in any stocks mentioned.
About SEHK:3332
Nanjing Sinolife United
An investment holding company, engages in the manufacture and sale of nutritional supplements in the People’s Republic of China, Australia, New Zealand, and internationally.
Flawless balance sheet with questionable track record.
Market Insights

Community Narratives


