- Hong Kong
- /
- Oil and Gas
- /
- SEHK:1088
China Shenhua Energy (HKG:1088) Has Gifted Shareholders With A Fantastic 111% Total Return On Their Investment

These days it's easy to simply buy an index fund, and your returns should (roughly) match the market. But you can do a lot better than that by buying good quality businesses for attractive prices. For example, the China Shenhua Energy Company Limited (HKG:1088) share price is 36% higher than it was five years ago, which is more than the market average. Zooming in, the stock is actually down 7.1% in the last year.
View our latest analysis for China Shenhua Energy
While the efficient markets hypothesis continues to be taught by some, it has been proven that markets are over-reactive dynamic systems, and investors are not always rational. One flawed but reasonable way to assess how sentiment around a company has changed is to compare the earnings per share (EPS) with the share price.
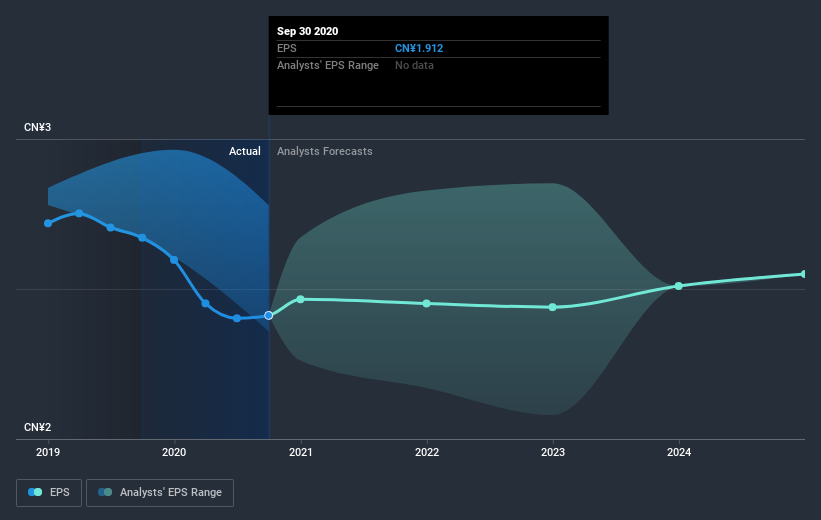
Over half a decade, China Shenhua Energy managed to grow its earnings per share at 7.1% a year. So the EPS growth rate is rather close to the annualized share price gain of 6% per year. This indicates that investor sentiment towards the company has not changed a great deal. In fact, the share price seems to largely reflect the EPS growth.
The image below shows how EPS has tracked over time (if you click on the image you can see greater detail).
We're pleased to report that the CEO is remunerated more modestly than most CEOs at similarly capitalized companies. But while CEO remuneration is always worth checking, the really important question is whether the company can grow earnings going forward. This free interactive report on China Shenhua Energy's earnings, revenue and cash flow is a great place to start, if you want to investigate the stock further.
What About Dividends?
As well as measuring the share price return, investors should also consider the total shareholder return (TSR). The TSR incorporates the value of any spin-offs or discounted capital raisings, along with any dividends, based on the assumption that the dividends are reinvested. Arguably, the TSR gives a more comprehensive picture of the return generated by a stock. As it happens, China Shenhua Energy's TSR for the last 5 years was 111%, which exceeds the share price return mentioned earlier. The dividends paid by the company have thusly boosted the total shareholder return.
A Different Perspective
China Shenhua Energy shareholders gained a total return of 2.6% during the year. But that return falls short of the market. It's probably a good sign that the company has an even better long term track record, having provided shareholders with an annual TSR of 16% over five years. It's quite possible the business continues to execute with prowess, even as the share price gains are slowing. It's always interesting to track share price performance over the longer term. But to understand China Shenhua Energy better, we need to consider many other factors. Like risks, for instance. Every company has them, and we've spotted 2 warning signs for China Shenhua Energy (of which 1 makes us a bit uncomfortable!) you should know about.
But note: China Shenhua Energy may not be the best stock to buy. So take a peek at this free list of interesting companies with past earnings growth (and further growth forecast).
Please note, the market returns quoted in this article reflect the market weighted average returns of stocks that currently trade on HK exchanges.
If you’re looking to trade China Shenhua Energy, open an account with the lowest-cost* platform trusted by professionals, Interactive Brokers. Their clients from over 200 countries and territories trade stocks, options, futures, forex, bonds and funds worldwide from a single integrated account. Promoted
New: AI Stock Screener & Alerts
Our new AI Stock Screener scans the market every day to uncover opportunities.
• Dividend Powerhouses (3%+ Yield)
• Undervalued Small Caps with Insider Buying
• High growth Tech and AI Companies
Or build your own from over 50 metrics.
This article by Simply Wall St is general in nature. It does not constitute a recommendation to buy or sell any stock, and does not take account of your objectives, or your financial situation. We aim to bring you long-term focused analysis driven by fundamental data. Note that our analysis may not factor in the latest price-sensitive company announcements or qualitative material. Simply Wall St has no position in any stocks mentioned.
*Interactive Brokers Rated Lowest Cost Broker by StockBrokers.com Annual Online Review 2020
Have feedback on this article? Concerned about the content? Get in touch with us directly. Alternatively, email editorial-team (at) simplywallst.com.
About SEHK:1088
China Shenhua Energy
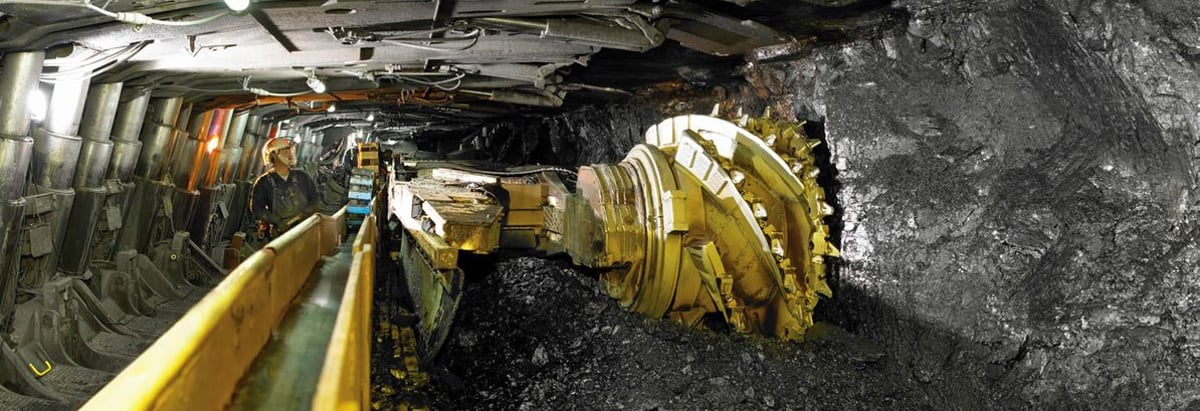
Engages in the production and sale of coal and power; railway, port, and shipping transportation businesses in the People’s Republic of China and internationally.
Flawless balance sheet average dividend payer.
