- Hong Kong
- /
- Capital Markets
- /
- SEHK:8365
Take Care Before Jumping Onto Hatcher Group Limited (HKG:8365) Even Though It's 29% Cheaper


To the annoyance of some shareholders, Hatcher Group Limited (HKG:8365) shares are down a considerable 29% in the last month, which continues a horrid run for the company. For any long-term shareholders, the last month ends a year to forget by locking in a 83% share price decline.
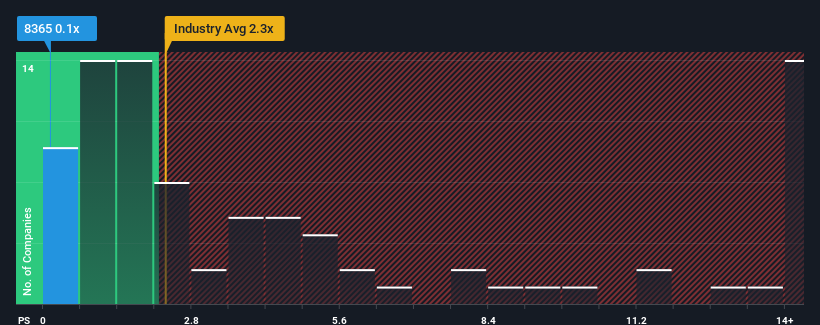
Following the heavy fall in price, Hatcher Group may look like a strong buying opportunity at present with its price-to-sales (or "P/S") ratio of 0.1x, considering almost half of all companies in the Capital Markets industry in Hong Kong have P/S ratios greater than 2.3x and even P/S higher than 10x aren't out of the ordinary. Although, it's not wise to just take the P/S at face value as there may be an explanation why it's so limited.
Check out our latest analysis for Hatcher Group
What Does Hatcher Group's Recent Performance Look Like?
The revenue growth achieved at Hatcher Group over the last year would be more than acceptable for most companies. One possibility is that the P/S is low because investors think this respectable revenue growth might actually underperform the broader industry in the near future. Those who are bullish on Hatcher Group will be hoping that this isn't the case, so that they can pick up the stock at a lower valuation.
Want the full picture on earnings, revenue and cash flow for the company? Then our free report on Hatcher Group will help you shine a light on its historical performance.Do Revenue Forecasts Match The Low P/S Ratio?
Hatcher Group's P/S ratio would be typical for a company that's expected to deliver very poor growth or even falling revenue, and importantly, perform much worse than the industry.
Taking a look back first, we see that the company grew revenue by an impressive 27% last year. Pleasingly, revenue has also lifted 210% in aggregate from three years ago, thanks to the last 12 months of growth. Therefore, it's fair to say the revenue growth recently has been superb for the company.
Comparing that recent medium-term revenue trajectory with the industry's one-year growth forecast of 33% shows it's noticeably more attractive.
With this in mind, we find it intriguing that Hatcher Group's P/S isn't as high compared to that of its industry peers. It looks like most investors are not convinced the company can maintain its recent growth rates.
What Does Hatcher Group's P/S Mean For Investors?
Hatcher Group's P/S looks about as weak as its stock price lately. While the price-to-sales ratio shouldn't be the defining factor in whether you buy a stock or not, it's quite a capable barometer of revenue expectations.
Our examination of Hatcher Group revealed its three-year revenue trends aren't boosting its P/S anywhere near as much as we would have predicted, given they look better than current industry expectations. When we see strong revenue with faster-than-industry growth, we assume there are some significant underlying risks to the company's ability to make money which is applying downwards pressure on the P/S ratio. At least price risks look to be very low if recent medium-term revenue trends continue, but investors seem to think future revenue could see a lot of volatility.
There are also other vital risk factors to consider and we've discovered 3 warning signs for Hatcher Group (2 don't sit too well with us!) that you should be aware of before investing here.
Of course, profitable companies with a history of great earnings growth are generally safer bets. So you may wish to see this free collection of other companies that have reasonable P/E ratios and have grown earnings strongly.
Valuation is complex, but we're here to simplify it.
Discover if Hatcher Group might be undervalued or overvalued with our detailed analysis, featuring fair value estimates, potential risks, dividends, insider trades, and its financial condition.
Access Free AnalysisHave feedback on this article? Concerned about the content? Get in touch with us directly. Alternatively, email editorial-team (at) simplywallst.com.
This article by Simply Wall St is general in nature. We provide commentary based on historical data and analyst forecasts only using an unbiased methodology and our articles are not intended to be financial advice. It does not constitute a recommendation to buy or sell any stock, and does not take account of your objectives, or your financial situation. We aim to bring you long-term focused analysis driven by fundamental data. Note that our analysis may not factor in the latest price-sensitive company announcements or qualitative material. Simply Wall St has no position in any stocks mentioned.
About SEHK:8365
Hatcher Group
An investment holding company, provides financial services in Hong Kong, the People's Republic of China, and Canada.
Excellent balance sheet slight.
Market Insights

Community Narratives

