
Advertisement
- Hong Kong
- /
- Capital Markets
- /
- SEHK:6881
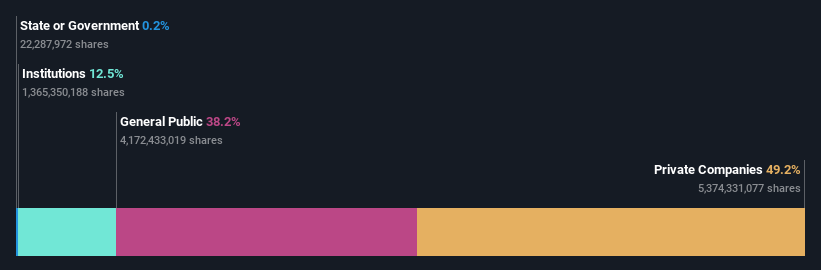
China Galaxy Securities Co., Ltd.'s (HKG:6881) largest shareholders are private companies with 49% ownership, individual investors own 38%

Key Insights
- China Galaxy Securities' significant private companies ownership suggests that the key decisions are influenced by shareholders from the larger public
- 51% of the business is held by the top 3 shareholders
- Institutional ownership in China Galaxy Securities is 12%
To get a sense of who is truly in control of China Galaxy Securities Co., Ltd. (HKG:6881), it is important to understand the ownership structure of the business. We can see that private companies own the lion's share in the company with 49% ownership. Put another way, the group faces the maximum upside potential (or downside risk).
Individual investors, on the other hand, account for 38% of the company's stockholders.
Let's delve deeper into each type of owner of China Galaxy Securities, beginning with the chart below.
See our latest analysis for China Galaxy Securities
What Does The Institutional Ownership Tell Us About China Galaxy Securities?
Many institutions measure their performance against an index that approximates the local market. So they usually pay more attention to companies that are included in major indices.
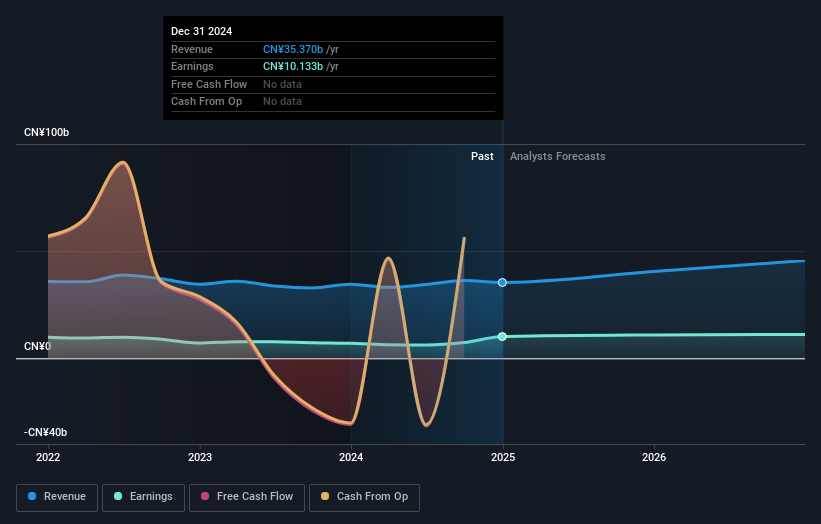
As you can see, institutional investors have a fair amount of stake in China Galaxy Securities. This can indicate that the company has a certain degree of credibility in the investment community. However, it is best to be wary of relying on the supposed validation that comes with institutional investors. They too, get it wrong sometimes. If multiple institutions change their view on a stock at the same time, you could see the share price drop fast. It's therefore worth looking at China Galaxy Securities' earnings history below. Of course, the future is what really matters.
China Galaxy Securities is not owned by hedge funds. Our data shows that China Galaxy Financial Holdings Company Limited is the largest shareholder with 47% of shares outstanding. BlackRock, Inc. is the second largest shareholder owning 1.8% of common stock, and The Vanguard Group, Inc. holds about 1.6% of the company stock.
After doing some more digging, we found that the top 3 shareholders collectively control more than half of the company's shares, implying that they have considerable power to influence the company's decisions.
Researching institutional ownership is a good way to gauge and filter a stock's expected performance. The same can be achieved by studying analyst sentiments. There are plenty of analysts covering the stock, so it might be worth seeing what they are forecasting, too.
Insider Ownership Of China Galaxy Securities
The definition of company insiders can be subjective and does vary between jurisdictions. Our data reflects individual insiders, capturing board members at the very least. Company management run the business, but the CEO will answer to the board, even if he or she is a member of it.
Most consider insider ownership a positive because it can indicate the board is well aligned with other shareholders. However, on some occasions too much power is concentrated within this group.
Our data cannot confirm that board members are holding shares personally. It is unusual not to have at least some personal holdings by board members, so our data might be flawed. A good next step would be to take a look at this free summary of insider buying and selling.
General Public Ownership
The general public-- including retail investors -- own 38% stake in the company, and hence can't easily be ignored. This size of ownership, while considerable, may not be enough to change company policy if the decision is not in sync with other large shareholders.
Private Company Ownership
We can see that Private Companies own 49%, of the shares on issue. Private companies may be related parties. Sometimes insiders have an interest in a public company through a holding in a private company, rather than in their own capacity as an individual. While it's hard to draw any broad stroke conclusions, it is worth noting as an area for further research.
Next Steps:
I find it very interesting to look at who exactly owns a company. But to truly gain insight, we need to consider other information, too.
Many find it useful to take an in depth look at how a company has performed in the past. You can access this detailed graph of past earnings, revenue and cash flow.
But ultimately it is the future, not the past, that will determine how well the owners of this business will do. Therefore we think it advisable to take a look at this free report showing whether analysts are predicting a brighter future.
NB: Figures in this article are calculated using data from the last twelve months, which refer to the 12-month period ending on the last date of the month the financial statement is dated. This may not be consistent with full year annual report figures.
New: AI Stock Screener & Alerts
Our new AI Stock Screener scans the market every day to uncover opportunities.
• Dividend Powerhouses (3%+ Yield)
• Undervalued Small Caps with Insider Buying
• High growth Tech and AI Companies
Or build your own from over 50 metrics.
Have feedback on this article? Concerned about the content? Get in touch with us directly. Alternatively, email editorial-team (at) simplywallst.com.
This article by Simply Wall St is general in nature. We provide commentary based on historical data and analyst forecasts only using an unbiased methodology and our articles are not intended to be financial advice. It does not constitute a recommendation to buy or sell any stock, and does not take account of your objectives, or your financial situation. We aim to bring you long-term focused analysis driven by fundamental data. Note that our analysis may not factor in the latest price-sensitive company announcements or qualitative material. Simply Wall St has no position in any stocks mentioned.
About SEHK:6881
China Galaxy Securities
Provides various financial services in the People’s Republic of China.
Good value with proven track record.
Similar Companies
Market Insights


Advertisement
Community Narratives
MicroStrategy: Volatile Gamble or Golden Opportunity?
Fair Value US$663.00|32.0% undervalued
BL
Community Contributor
Emerging Markets and Debt Reduction Will Propel Bath & Body Works Forward
Fair Value US$40.73|21.7% undervalued
ZW
Community Contributor
An amazing opportunity to potentially get a 100 bagger
Fair Value US$10.00|0.5% overvalued
DA
Community Contributor