- Hong Kong
- /
- Hospitality
- /
- SEHK:520
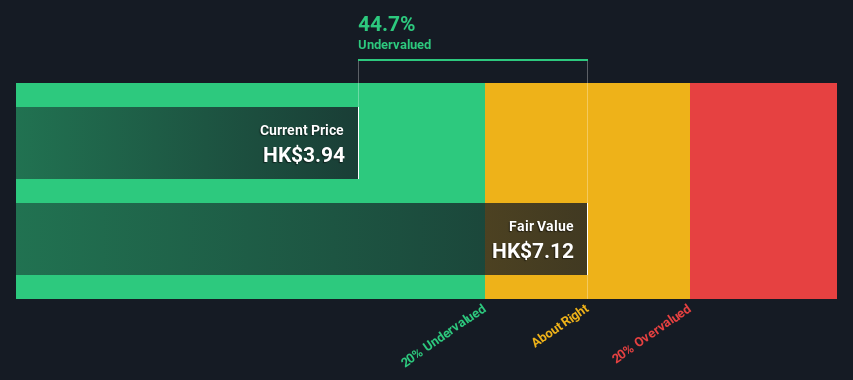
Xiabuxiabu Catering Management (China) Holdings Co., Ltd.'s (HKG:520) Intrinsic Value Is Potentially 81% Above Its Share Price


Key Insights
- Using the 2 Stage Free Cash Flow to Equity, Xiabuxiabu Catering Management (China) Holdings fair value estimate is HK$7.12
- Xiabuxiabu Catering Management (China) Holdings' HK$3.94 share price signals that it might be 45% undervalued
- Our fair value estimate is 12% lower than Xiabuxiabu Catering Management (China) Holdings' analyst price target of CN¥8.07
Today we'll do a simple run through of a valuation method used to estimate the attractiveness of Xiabuxiabu Catering Management (China) Holdings Co., Ltd. (HKG:520) as an investment opportunity by taking the expected future cash flows and discounting them to their present value. We will take advantage of the Discounted Cash Flow (DCF) model for this purpose. Don't get put off by the jargon, the math behind it is actually quite straightforward.
Companies can be valued in a lot of ways, so we would point out that a DCF is not perfect for every situation. Anyone interested in learning a bit more about intrinsic value should have a read of the Simply Wall St analysis model.
Check out our latest analysis for Xiabuxiabu Catering Management (China) Holdings
Crunching The Numbers
We use what is known as a 2-stage model, which simply means we have two different periods of growth rates for the company's cash flows. Generally the first stage is higher growth, and the second stage is a lower growth phase. To start off with, we need to estimate the next ten years of cash flows. Where possible we use analyst estimates, but when these aren't available we extrapolate the previous free cash flow (FCF) from the last estimate or reported value. We assume companies with shrinking free cash flow will slow their rate of shrinkage, and that companies with growing free cash flow will see their growth rate slow, over this period. We do this to reflect that growth tends to slow more in the early years than it does in later years.
Generally we assume that a dollar today is more valuable than a dollar in the future, so we need to discount the sum of these future cash flows to arrive at a present value estimate:
10-year free cash flow (FCF) estimate
| 2023 | 2024 | 2025 | 2026 | 2027 | 2028 | 2029 | 2030 | 2031 | 2032 | |
| Levered FCF (CN¥, Millions) | CN¥599.0m | CN¥385.5m | CN¥643.5m | CN¥660.1m | CN¥675.5m | CN¥690.2m | CN¥704.5m | CN¥718.5m | CN¥732.3m | CN¥746.2m |
| Growth Rate Estimate Source | Analyst x2 | Analyst x2 | Analyst x2 | Est @ 2.57% | Est @ 2.34% | Est @ 2.18% | Est @ 2.07% | Est @ 1.99% | Est @ 1.93% | Est @ 1.89% |
| Present Value (CN¥, Millions) Discounted @ 10% | CN¥542 | CN¥316 | CN¥478 | CN¥444 | CN¥411 | CN¥381 | CN¥352 | CN¥325 | CN¥300 | CN¥277 |
("Est" = FCF growth rate estimated by Simply Wall St)
Present Value of 10-year Cash Flow (PVCF) = CN¥3.8b
After calculating the present value of future cash flows in the initial 10-year period, we need to calculate the Terminal Value, which accounts for all future cash flows beyond the first stage. For a number of reasons a very conservative growth rate is used that cannot exceed that of a country's GDP growth. In this case we have used the 5-year average of the 10-year government bond yield (1.8%) to estimate future growth. In the same way as with the 10-year 'growth' period, we discount future cash flows to today's value, using a cost of equity of 10%.
Terminal Value (TV)= FCF2032 × (1 + g) ÷ (r – g) = CN¥746m× (1 + 1.8%) ÷ (10%– 1.8%) = CN¥8.8b
Present Value of Terminal Value (PVTV)= TV / (1 + r)10= CN¥8.8b÷ ( 1 + 10%)10= CN¥3.3b
The total value is the sum of cash flows for the next ten years plus the discounted terminal value, which results in the Total Equity Value, which in this case is CN¥7.1b. To get the intrinsic value per share, we divide this by the total number of shares outstanding. Compared to the current share price of HK$3.9, the company appears quite undervalued at a 45% discount to where the stock price trades currently. The assumptions in any calculation have a big impact on the valuation, so it is better to view this as a rough estimate, not precise down to the last cent.
Important Assumptions
Now the most important inputs to a discounted cash flow are the discount rate, and of course, the actual cash flows. You don't have to agree with these inputs, I recommend redoing the calculations yourself and playing with them. The DCF also does not consider the possible cyclicality of an industry, or a company's future capital requirements, so it does not give a full picture of a company's potential performance. Given that we are looking at Xiabuxiabu Catering Management (China) Holdings as potential shareholders, the cost of equity is used as the discount rate, rather than the cost of capital (or weighted average cost of capital, WACC) which accounts for debt. In this calculation we've used 10%, which is based on a levered beta of 1.206. Beta is a measure of a stock's volatility, compared to the market as a whole. We get our beta from the industry average beta of globally comparable companies, with an imposed limit between 0.8 and 2.0, which is a reasonable range for a stable business.
SWOT Analysis for Xiabuxiabu Catering Management (China) Holdings
- Debt is not viewed as a risk.
- Dividend is low compared to the top 25% of dividend payers in the Hospitality market.
- Expected to breakeven next year.
- Has sufficient cash runway for more than 3 years based on current free cash flows.
- Good value based on P/S ratio and estimated fair value.
- Paying a dividend but company is unprofitable.
Looking Ahead:
Valuation is only one side of the coin in terms of building your investment thesis, and it ideally won't be the sole piece of analysis you scrutinize for a company. DCF models are not the be-all and end-all of investment valuation. Preferably you'd apply different cases and assumptions and see how they would impact the company's valuation. For instance, if the terminal value growth rate is adjusted slightly, it can dramatically alter the overall result. Why is the intrinsic value higher than the current share price? For Xiabuxiabu Catering Management (China) Holdings, there are three essential elements you should consider:
- Financial Health: Does 520 have a healthy balance sheet? Take a look at our free balance sheet analysis with six simple checks on key factors like leverage and risk.
- Future Earnings: How does 520's growth rate compare to its peers and the wider market? Dig deeper into the analyst consensus number for the upcoming years by interacting with our free analyst growth expectation chart.
- Other Solid Businesses: Low debt, high returns on equity and good past performance are fundamental to a strong business. Why not explore our interactive list of stocks with solid business fundamentals to see if there are other companies you may not have considered!
PS. The Simply Wall St app conducts a discounted cash flow valuation for every stock on the SEHK every day. If you want to find the calculation for other stocks just search here.
New: AI Stock Screener & Alerts
Our new AI Stock Screener scans the market every day to uncover opportunities.
• Dividend Powerhouses (3%+ Yield)
• Undervalued Small Caps with Insider Buying
• High growth Tech and AI Companies
Or build your own from over 50 metrics.
Have feedback on this article? Concerned about the content? Get in touch with us directly. Alternatively, email editorial-team (at) simplywallst.com.
This article by Simply Wall St is general in nature. We provide commentary based on historical data and analyst forecasts only using an unbiased methodology and our articles are not intended to be financial advice. It does not constitute a recommendation to buy or sell any stock, and does not take account of your objectives, or your financial situation. We aim to bring you long-term focused analysis driven by fundamental data. Note that our analysis may not factor in the latest price-sensitive company announcements or qualitative material. Simply Wall St has no position in any stocks mentioned.
About SEHK:520
Xiabuxiabu Catering Management (China) Holdings
An investment holding company, operates Chinese hotpot restaurants in the People’s Republic of China.
Undervalued with reasonable growth potential.
Market Insights

Community Narratives
