
Advertisement
- Hong Kong
- /
- Hospitality
- /
- SEHK:3690
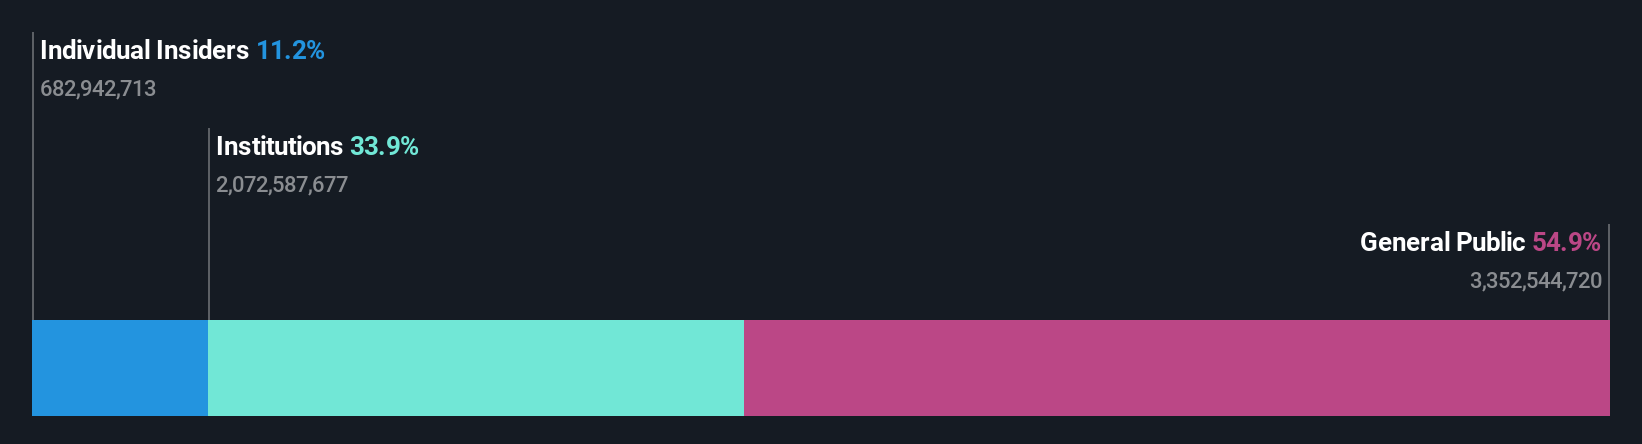
While institutions own 34% of Meituan (HKG:3690), individual investors are its largest shareholders with 55% ownership
Key Insights
- Significant control over Meituan by individual investors implies that the general public has more power to influence management and governance-related decisions
- The top 25 shareholders own 35% of the company
- Insiders have been selling lately
To get a sense of who is truly in control of Meituan (HKG:3690), it is important to understand the ownership structure of the business. And the group that holds the biggest piece of the pie are individual investors with 55% ownership. In other words, the group stands to gain the most (or lose the most) from their investment into the company.
Meanwhile, institutions make up 34% of the company’s shareholders. Generally speaking, as a company grows, institutions will increase their ownership. Conversely, insiders often decrease their ownership over time.
In the chart below, we zoom in on the different ownership groups of Meituan.
Check out our latest analysis for Meituan
What Does The Institutional Ownership Tell Us About Meituan?
Many institutions measure their performance against an index that approximates the local market. So they usually pay more attention to companies that are included in major indices.
As you can see, institutional investors have a fair amount of stake in Meituan. This implies the analysts working for those institutions have looked at the stock and they like it. But just like anyone else, they could be wrong. It is not uncommon to see a big share price drop if two large institutional investors try to sell out of a stock at the same time. So it is worth checking the past earnings trajectory of Meituan, (below). Of course, keep in mind that there are other factors to consider, too.
Meituan is not owned by hedge funds. Looking at our data, we can see that the largest shareholder is the CEO Xing Wang with 9.2% of shares outstanding. BlackRock, Inc. is the second largest shareholder owning 5.5% of common stock, and The Vanguard Group, Inc. holds about 3.7% of the company stock.
A deeper look at our ownership data shows that the top 25 shareholders collectively hold less than half of the register, suggesting a large group of small holders where no single shareholder has a majority.
While it makes sense to study institutional ownership data for a company, it also makes sense to study analyst sentiments to know which way the wind is blowing. Quite a few analysts cover the stock, so you could look into forecast growth quite easily.
Insider Ownership Of Meituan
The definition of company insiders can be subjective and does vary between jurisdictions. Our data reflects individual insiders, capturing board members at the very least. Company management run the business, but the CEO will answer to the board, even if he or she is a member of it.
I generally consider insider ownership to be a good thing. However, on some occasions it makes it more difficult for other shareholders to hold the board accountable for decisions.
Our most recent data indicates that insiders own a reasonable proportion of Meituan. It has a market capitalization of just HK$628b, and insiders have HK$70b worth of shares in their own names. That's quite significant. It is good to see this level of investment. You can check here to see if those insiders have been buying recently.
General Public Ownership
The general public -- including retail investors -- own 55% of Meituan. This level of ownership gives investors from the wider public some power to sway key policy decisions such as board composition, executive compensation, and the dividend payout ratio.
Next Steps:
It's always worth thinking about the different groups who own shares in a company. But to understand Meituan better, we need to consider many other factors.
I always like to check for a history of revenue growth. You can too, by accessing this free chart of historic revenue and earnings in this detailed graph.
Ultimately the future is most important. You can access this free report on analyst forecasts for the company.
NB: Figures in this article are calculated using data from the last twelve months, which refer to the 12-month period ending on the last date of the month the financial statement is dated. This may not be consistent with full year annual report figures.
New: Manage All Your Stock Portfolios in One Place
We've created the ultimate portfolio companion for stock investors, and it's free.
• Connect an unlimited number of Portfolios and see your total in one currency
• Be alerted to new Warning Signs or Risks via email or mobile
• Track the Fair Value of your stocks
Have feedback on this article? Concerned about the content? Get in touch with us directly. Alternatively, email editorial-team (at) simplywallst.com.
This article by Simply Wall St is general in nature. We provide commentary based on historical data and analyst forecasts only using an unbiased methodology and our articles are not intended to be financial advice. It does not constitute a recommendation to buy or sell any stock, and does not take account of your objectives, or your financial situation. We aim to bring you long-term focused analysis driven by fundamental data. Note that our analysis may not factor in the latest price-sensitive company announcements or qualitative material. Simply Wall St has no position in any stocks mentioned.
About SEHK:3690
Meituan
Operates as a technology driven retail company in the People’s Republic of China, Hong Kong, Macao, Taiwan, and internationally.
Excellent balance sheet with reasonable growth potential.
Similar Companies
Market Insights


Advertisement
Community Narratives
America Wants Homegrown Drones — Draganfly Is Ready to Deliver
Fair Value US$9.21|24.5% undervalued
JO
Community Contributor
Cheesecake Factory offers an enticing opportunity for long-term growth by leveraging new concepts
Fair Value US$73.83|24.8% undervalued
ZW
Community Contributor
Coca-Cola’s Intrinsic Value Set to Rise with Fed Rate Cut
Fair Value US$67.50|2.2% undervalued
AL
Community Contributor
Fully Permitted Gold Mine with 50 Baggers Potential 
Fair Value CA$41.00|97.7% undervalued
RO
Community Contributor