
Advertisement
- Hong Kong
- /
- Consumer Services
- /
- SEHK:3650
Keep Inc.'s (HKG:3650) 27% Share Price Surge Not Quite Adding Up
Despite an already strong run, Keep Inc. (HKG:3650) shares have been powering on, with a gain of 27% in the last thirty days. While recent buyers may be laughing, long-term holders might not be as pleased since the recent gain only brings the stock back to where it started a year ago.
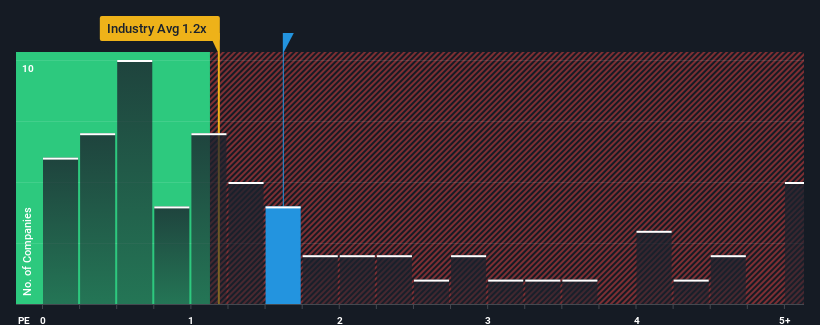
Although its price has surged higher, it's still not a stretch to say that Keep's price-to-sales (or "P/S") ratio of 1.6x right now seems quite "middle-of-the-road" compared to the Consumer Services industry in Hong Kong, where the median P/S ratio is around 1.2x. While this might not raise any eyebrows, if the P/S ratio is not justified investors could be missing out on a potential opportunity or ignoring looming disappointment.
Check out our latest analysis for Keep
What Does Keep's P/S Mean For Shareholders?
Keep hasn't been tracking well recently as its declining revenue compares poorly to other companies, which have seen some growth in their revenues on average. Perhaps the market is expecting its poor revenue performance to improve, keeping the P/S from dropping. However, if this isn't the case, investors might get caught out paying too much for the stock.
Want the full picture on analyst estimates for the company? Then our free report on Keep will help you uncover what's on the horizon.Do Revenue Forecasts Match The P/S Ratio?
Keep's P/S ratio would be typical for a company that's only expected to deliver moderate growth, and importantly, perform in line with the industry.
In reviewing the last year of financials, we were disheartened to see the company's revenues fell to the tune of 3.3%. Still, the latest three year period has seen an excellent 93% overall rise in revenue, in spite of its unsatisfying short-term performance. Accordingly, while they would have preferred to keep the run going, shareholders would definitely welcome the medium-term rates of revenue growth.
Turning to the outlook, the next three years should generate growth of 7.8% per year as estimated by the two analysts watching the company. With the industry predicted to deliver 17% growth per annum, the company is positioned for a weaker revenue result.
In light of this, it's curious that Keep's P/S sits in line with the majority of other companies. Apparently many investors in the company are less bearish than analysts indicate and aren't willing to let go of their stock right now. Maintaining these prices will be difficult to achieve as this level of revenue growth is likely to weigh down the shares eventually.
The Bottom Line On Keep's P/S
Its shares have lifted substantially and now Keep's P/S is back within range of the industry median. It's argued the price-to-sales ratio is an inferior measure of value within certain industries, but it can be a powerful business sentiment indicator.
Our look at the analysts forecasts of Keep's revenue prospects has shown that its inferior revenue outlook isn't negatively impacting its P/S as much as we would have predicted. At present, we aren't confident in the P/S as the predicted future revenues aren't likely to support a more positive sentiment for long. Circumstances like this present a risk to current and prospective investors who may see share prices fall if the low revenue growth impacts the sentiment.
It's always necessary to consider the ever-present spectre of investment risk. We've identified 3 warning signs with Keep, and understanding them should be part of your investment process.
If these risks are making you reconsider your opinion on Keep, explore our interactive list of high quality stocks to get an idea of what else is out there.
Valuation is complex, but we're here to simplify it.
Discover if Keep might be undervalued or overvalued with our detailed analysis, featuring fair value estimates, potential risks, dividends, insider trades, and its financial condition.
Access Free AnalysisHave feedback on this article? Concerned about the content? Get in touch with us directly. Alternatively, email editorial-team (at) simplywallst.com.
This article by Simply Wall St is general in nature. We provide commentary based on historical data and analyst forecasts only using an unbiased methodology and our articles are not intended to be financial advice. It does not constitute a recommendation to buy or sell any stock, and does not take account of your objectives, or your financial situation. We aim to bring you long-term focused analysis driven by fundamental data. Note that our analysis may not factor in the latest price-sensitive company announcements or qualitative material. Simply Wall St has no position in any stocks mentioned.
About SEHK:3650
Keep
An investment holding company, operates an integrated online and offline platform for fitness service and online retail of fitness related products in the People’s Republic of China.
Excellent balance sheet with reasonable growth potential.
Market Insights

Advertisement
Community Narratives
A formidable player in AI and enterprise computing.
Fair Value US$210.00|13.6% overvalued
CO
Community Contributor
IREN's Bold Moves in Sustainable Bitcoin Mining & AI Data Centers
Fair Value US$89.00|23.6% undervalued
BL
Community Contributor
Cooling the Champions: The Aussie Tech Behind F1's Victories
Fair Value AU$12.40|40.6% undervalued
TR
Community Contributor