
Advertisement
- Hong Kong
- /
- Trade Distributors
- /
- SEHK:997
Will The ROCE Trend At Chinlink International Holdings (HKG:997) Continue?

What are the early trends we should look for to identify a stock that could multiply in value over the long term? Typically, we'll want to notice a trend of growing return on capital employed (ROCE) and alongside that, an expanding base of capital employed. If you see this, it typically means it's a company with a great business model and plenty of profitable reinvestment opportunities. So when we looked at Chinlink International Holdings (HKG:997) and its trend of ROCE, we really liked what we saw.
Understanding Return On Capital Employed (ROCE)
For those that aren't sure what ROCE is, it measures the amount of pre-tax profits a company can generate from the capital employed in its business. To calculate this metric for Chinlink International Holdings, this is the formula:
Return on Capital Employed = Earnings Before Interest and Tax (EBIT) ÷ (Total Assets - Current Liabilities)
0.0016 = HK$4.4m ÷ (HK$4.9b - HK$2.2b) (Based on the trailing twelve months to September 2020).
Thus, Chinlink International Holdings has an ROCE of 0.2%. Ultimately, that's a low return and it under-performs the Trade Distributors industry average of 5.4%.
View our latest analysis for Chinlink International Holdings
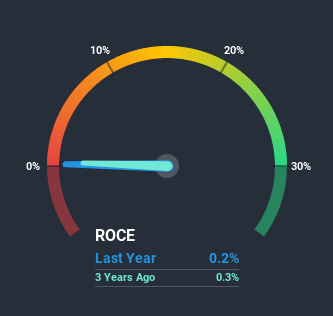
Historical performance is a great place to start when researching a stock so above you can see the gauge for Chinlink International Holdings' ROCE against it's prior returns. If you're interested in investigating Chinlink International Holdings' past further, check out this free graph of past earnings, revenue and cash flow.
The Trend Of ROCE
Chinlink International Holdings has recently broken into profitability so their prior investments seem to be paying off. The company was generating losses five years ago, but now it's earning 0.2% which is a sight for sore eyes. Not only that, but the company is utilizing 21% more capital than before, but that's to be expected from a company trying to break into profitability. This can tell us that the company has plenty of reinvestment opportunities that are able to generate higher returns.
For the record though, there was a noticeable increase in the company's current liabilities over the period, so we would attribute some of the ROCE growth to that. The current liabilities has increased to 45% of total assets, so the business is now more funded by the likes of its suppliers or short-term creditors. Given it's pretty high ratio, we'd remind investors that having current liabilities at those levels can bring about some risks in certain businesses.
What We Can Learn From Chinlink International Holdings' ROCE
Overall, Chinlink International Holdings gets a big tick from us thanks in most part to the fact that it is now profitable and is reinvesting in its business. And since the stock has dived 99% over the last five years, there may be other factors affecting the company's prospects. Regardless, we think the underlying fundamentals warrant this stock for further investigation.
One final note, you should learn about the 3 warning signs we've spotted with Chinlink International Holdings (including 2 which make us uncomfortable) .
While Chinlink International Holdings may not currently earn the highest returns, we've compiled a list of companies that currently earn more than 25% return on equity. Check out this free list here.
When trading Chinlink International Holdings or any other investment, use the platform considered by many to be the Professional's Gateway to the Worlds Market, Interactive Brokers. You get the lowest-cost* trading on stocks, options, futures, forex, bonds and funds worldwide from a single integrated account. Promoted
New: AI Stock Screener & Alerts
Our new AI Stock Screener scans the market every day to uncover opportunities.
• Dividend Powerhouses (3%+ Yield)
• Undervalued Small Caps with Insider Buying
• High growth Tech and AI Companies
Or build your own from over 50 metrics.
This article by Simply Wall St is general in nature. It does not constitute a recommendation to buy or sell any stock, and does not take account of your objectives, or your financial situation. We aim to bring you long-term focused analysis driven by fundamental data. Note that our analysis may not factor in the latest price-sensitive company announcements or qualitative material. Simply Wall St has no position in any stocks mentioned.
*Interactive Brokers Rated Lowest Cost Broker by StockBrokers.com Annual Online Review 2020
Have feedback on this article? Concerned about the content? Get in touch with us directly. Alternatively, email editorial-team (at) simplywallst.com.
About SEHK:997
Chinlink International Holdings
An investment holding company, provides property investment services in the People’s Republic of China and Hong Kong.
Slight and overvalued.
Market Insights

Advertisement
Community Narratives
Scaling up in building materials with smart M&A and growing profitability
Fair Value US$2.77|31.0% undervalued
CM
Community Contributor
Hims: The Platform Powering Personalised Healthcare
Fair Value US$114.01|53.1% undervalued
BL
Community Contributor
Undervalued lottery company with strong fundamentals
Fair Value AU$15.00|34.5% undervalued
RO
Community Contributor
Proximus, transferring money from the impatient to the patient investor
Fair Value €16.62|54.5% undervalued
AX
Community Contributor