- Hong Kong
- /
- Construction
- /
- SEHK:8021
WLS Holdings Limited's (HKG:8021) 29% Share Price Plunge Could Signal Some Risk


To the annoyance of some shareholders, WLS Holdings Limited (HKG:8021) shares are down a considerable 29% in the last month, which continues a horrid run for the company. The drop over the last 30 days has capped off a tough year for shareholders, with the share price down 35% in that time.
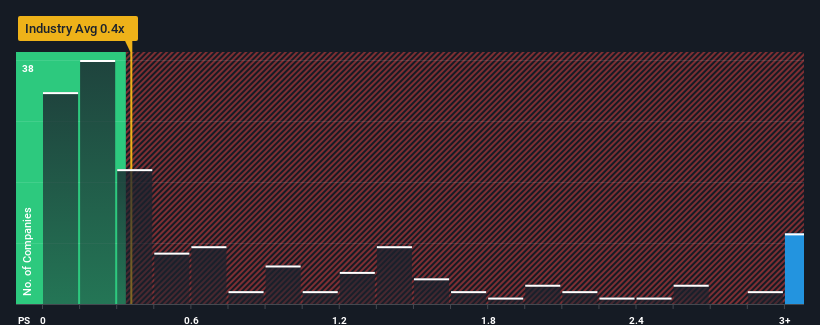
Even after such a large drop in price, when almost half of the companies in Hong Kong's Construction industry have price-to-sales ratios (or "P/S") below 0.4x, you may still consider WLS Holdings as a stock not worth researching with its 3.8x P/S ratio. Although, it's not wise to just take the P/S at face value as there may be an explanation why it's so lofty.
View our latest analysis for WLS Holdings
How Has WLS Holdings Performed Recently?
For example, consider that WLS Holdings' financial performance has been poor lately as its revenue has been in decline. One possibility is that the P/S is high because investors think the company will still do enough to outperform the broader industry in the near future. However, if this isn't the case, investors might get caught out paying too much for the stock.
Want the full picture on earnings, revenue and cash flow for the company? Then our free report on WLS Holdings will help you shine a light on its historical performance.Do Revenue Forecasts Match The High P/S Ratio?
The only time you'd be truly comfortable seeing a P/S as steep as WLS Holdings' is when the company's growth is on track to outshine the industry decidedly.
Taking a look back first, the company's revenue growth last year wasn't something to get excited about as it posted a disappointing decline of 23%. This has erased any of its gains during the last three years, with practically no change in revenue being achieved in total. Therefore, it's fair to say that revenue growth has been inconsistent recently for the company.
Comparing that to the industry, which is predicted to deliver 16% growth in the next 12 months, the company's momentum is weaker, based on recent medium-term annualised revenue results.
In light of this, it's alarming that WLS Holdings' P/S sits above the majority of other companies. Apparently many investors in the company are way more bullish than recent times would indicate and aren't willing to let go of their stock at any price. There's a good chance existing shareholders are setting themselves up for future disappointment if the P/S falls to levels more in line with recent growth rates.
What We Can Learn From WLS Holdings' P/S?
Even after such a strong price drop, WLS Holdings' P/S still exceeds the industry median significantly. It's argued the price-to-sales ratio is an inferior measure of value within certain industries, but it can be a powerful business sentiment indicator.
The fact that WLS Holdings currently trades on a higher P/S relative to the industry is an oddity, since its recent three-year growth is lower than the wider industry forecast. When we observe slower-than-industry revenue growth alongside a high P/S ratio, we assume there to be a significant risk of the share price decreasing, which would result in a lower P/S ratio. Unless there is a significant improvement in the company's medium-term performance, it will be difficult to prevent the P/S ratio from declining to a more reasonable level.
Before you settle on your opinion, we've discovered 1 warning sign for WLS Holdings that you should be aware of.
If you're unsure about the strength of WLS Holdings' business, why not explore our interactive list of stocks with solid business fundamentals for some other companies you may have missed.
Valuation is complex, but we're here to simplify it.
Discover if WLS Holdings might be undervalued or overvalued with our detailed analysis, featuring fair value estimates, potential risks, dividends, insider trades, and its financial condition.
Access Free AnalysisHave feedback on this article? Concerned about the content? Get in touch with us directly. Alternatively, email editorial-team (at) simplywallst.com.
This article by Simply Wall St is general in nature. We provide commentary based on historical data and analyst forecasts only using an unbiased methodology and our articles are not intended to be financial advice. It does not constitute a recommendation to buy or sell any stock, and does not take account of your objectives, or your financial situation. We aim to bring you long-term focused analysis driven by fundamental data. Note that our analysis may not factor in the latest price-sensitive company announcements or qualitative material. Simply Wall St has no position in any stocks mentioned.
About SEHK:8021
WLS Holdings
An investment holding company, provides scaffolding, fitting out, and other auxiliary services for the construction and building works businesses in Hong Kong.
Adequate balance sheet low.
Similar Companies
Market Insights

Community Narratives
