- Hong Kong
- /
- Trade Distributors
- /
- SEHK:387
The Return Trends At Leeport (Holdings) (HKG:387) Look Promising


If we want to find a potential multi-bagger, often there are underlying trends that can provide clues. In a perfect world, we'd like to see a company investing more capital into its business and ideally the returns earned from that capital are also increasing. Put simply, these types of businesses are compounding machines, meaning they are continually reinvesting their earnings at ever-higher rates of return. Speaking of which, we noticed some great changes in Leeport (Holdings)'s (HKG:387) returns on capital, so let's have a look.
What Is Return On Capital Employed (ROCE)?
If you haven't worked with ROCE before, it measures the 'return' (pre-tax profit) a company generates from capital employed in its business. Analysts use this formula to calculate it for Leeport (Holdings):
Return on Capital Employed = Earnings Before Interest and Tax (EBIT) ÷ (Total Assets - Current Liabilities)
0.076 = HK$38m ÷ (HK$773m - HK$269m) (Based on the trailing twelve months to June 2024).
Thus, Leeport (Holdings) has an ROCE of 7.6%. On its own that's a low return, but compared to the average of 5.9% generated by the Trade Distributors industry, it's much better.
View our latest analysis for Leeport (Holdings)
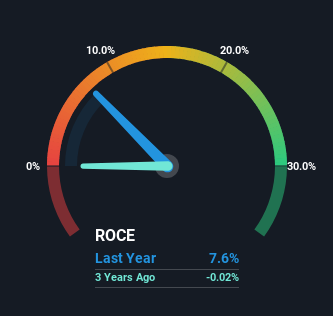
Historical performance is a great place to start when researching a stock so above you can see the gauge for Leeport (Holdings)'s ROCE against it's prior returns. If you're interested in investigating Leeport (Holdings)'s past further, check out this free graph covering Leeport (Holdings)'s past earnings, revenue and cash flow.
What The Trend Of ROCE Can Tell Us
Leeport (Holdings) has broken into the black (profitability) and we're sure it's a sight for sore eyes. The company was generating losses five years ago, but has managed to turn it around and as we saw earlier is now earning 7.6%, which is always encouraging. While returns have increased, the amount of capital employed by Leeport (Holdings) has remained flat over the period. With no noticeable increase in capital employed, it's worth knowing what the company plans on doing going forward in regards to reinvesting and growing the business. Because in the end, a business can only get so efficient.
In another part of our analysis, we noticed that the company's ratio of current liabilities to total assets decreased to 35%, which broadly means the business is relying less on its suppliers or short-term creditors to fund its operations. So shareholders would be pleased that the growth in returns has mostly come from underlying business performance.
In Conclusion...
As discussed above, Leeport (Holdings) appears to be getting more proficient at generating returns since capital employed has remained flat but earnings (before interest and tax) are up. Investors may not be impressed by the favorable underlying trends yet because over the last five years the stock has only returned 25% to shareholders. Given that, we'd look further into this stock in case it has more traits that could make it multiply in the long term.
If you'd like to know about the risks facing Leeport (Holdings), we've discovered 3 warning signs that you should be aware of.
If you want to search for solid companies with great earnings, check out this free list of companies with good balance sheets and impressive returns on equity.
If you're looking to trade Leeport (Holdings), open an account with the lowest-cost platform trusted by professionals, Interactive Brokers.
With clients in over 200 countries and territories, and access to 160 markets, IBKR lets you trade stocks, options, futures, forex, bonds and funds from a single integrated account.
Enjoy no hidden fees, no account minimums, and FX conversion rates as low as 0.03%, far better than what most brokers offer.
Sponsored ContentNew: AI Stock Screener & Alerts
Our new AI Stock Screener scans the market every day to uncover opportunities.
• Dividend Powerhouses (3%+ Yield)
• Undervalued Small Caps with Insider Buying
• High growth Tech and AI Companies
Or build your own from over 50 metrics.
Have feedback on this article? Concerned about the content? Get in touch with us directly. Alternatively, email editorial-team (at) simplywallst.com.
This article by Simply Wall St is general in nature. We provide commentary based on historical data and analyst forecasts only using an unbiased methodology and our articles are not intended to be financial advice. It does not constitute a recommendation to buy or sell any stock, and does not take account of your objectives, or your financial situation. We aim to bring you long-term focused analysis driven by fundamental data. Note that our analysis may not factor in the latest price-sensitive company announcements or qualitative material. Simply Wall St has no position in any stocks mentioned.
About SEHK:387
Leeport (Holdings)
An investment holding company, engages in the trading of metalworking machinery, measuring instruments, cutting tools, and electronic equipment in the People’s Republic of China, Hong Kong, and internationally.
Flawless balance sheet established dividend payer.
Market Insights

Community Narratives


