- Hong Kong
- /
- Construction
- /
- SEHK:3708
Investors Give China Supply Chain Holdings Limited (HKG:3708) Shares A 27% Hiding


To the annoyance of some shareholders, China Supply Chain Holdings Limited (HKG:3708) shares are down a considerable 27% in the last month, which continues a horrid run for the company. To make matters worse, the recent drop has wiped out a year's worth of gains with the share price now back where it started a year ago.
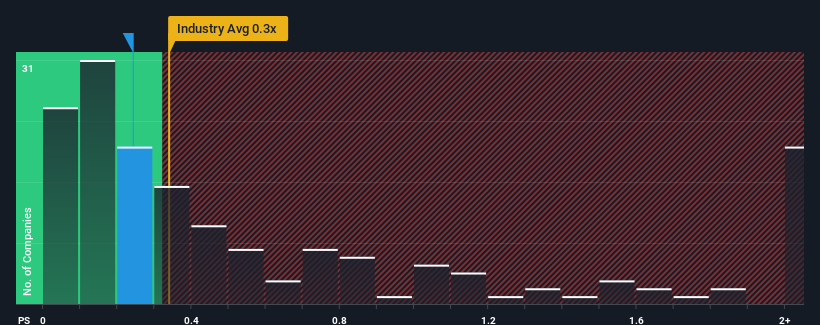
Although its price has dipped substantially, you could still be forgiven for feeling indifferent about China Supply Chain Holdings' P/S ratio of 0.2x, since the median price-to-sales (or "P/S") ratio for the Construction industry in Hong Kong is also close to 0.3x. While this might not raise any eyebrows, if the P/S ratio is not justified investors could be missing out on a potential opportunity or ignoring looming disappointment.
Check out our latest analysis for China Supply Chain Holdings
What Does China Supply Chain Holdings' P/S Mean For Shareholders?
Revenue has risen firmly for China Supply Chain Holdings recently, which is pleasing to see. One possibility is that the P/S is moderate because investors think this respectable revenue growth might not be enough to outperform the broader industry in the near future. If you like the company, you'd be hoping this isn't the case so that you could potentially pick up some stock while it's not quite in favour.
Although there are no analyst estimates available for China Supply Chain Holdings, take a look at this free data-rich visualisation to see how the company stacks up on earnings, revenue and cash flow.What Are Revenue Growth Metrics Telling Us About The P/S?
China Supply Chain Holdings' P/S ratio would be typical for a company that's only expected to deliver moderate growth, and importantly, perform in line with the industry.
Taking a look back first, we see that the company grew revenue by an impressive 26% last year. Pleasingly, revenue has also lifted 44% in aggregate from three years ago, thanks to the last 12 months of growth. So we can start by confirming that the company has done a great job of growing revenue over that time.
Comparing that recent medium-term revenue trajectory with the industry's one-year growth forecast of 9.2% shows it's noticeably more attractive.
In light of this, it's curious that China Supply Chain Holdings' P/S sits in line with the majority of other companies. It may be that most investors are not convinced the company can maintain its recent growth rates.
The Final Word
With its share price dropping off a cliff, the P/S for China Supply Chain Holdings looks to be in line with the rest of the Construction industry. It's argued the price-to-sales ratio is an inferior measure of value within certain industries, but it can be a powerful business sentiment indicator.
We've established that China Supply Chain Holdings currently trades on a lower than expected P/S since its recent three-year growth is higher than the wider industry forecast. It'd be fair to assume that potential risks the company faces could be the contributing factor to the lower than expected P/S. While recent revenue trends over the past medium-term suggest that the risk of a price decline is low, investors appear to see the likelihood of revenue fluctuations in the future.
There are also other vital risk factors to consider and we've discovered 2 warning signs for China Supply Chain Holdings (1 is potentially serious!) that you should be aware of before investing here.
If these risks are making you reconsider your opinion on China Supply Chain Holdings, explore our interactive list of high quality stocks to get an idea of what else is out there.
New: AI Stock Screener & Alerts
Our new AI Stock Screener scans the market every day to uncover opportunities.
• Dividend Powerhouses (3%+ Yield)
• Undervalued Small Caps with Insider Buying
• High growth Tech and AI Companies
Or build your own from over 50 metrics.
Have feedback on this article? Concerned about the content? Get in touch with us directly. Alternatively, email editorial-team (at) simplywallst.com.
This article by Simply Wall St is general in nature. We provide commentary based on historical data and analyst forecasts only using an unbiased methodology and our articles are not intended to be financial advice. It does not constitute a recommendation to buy or sell any stock, and does not take account of your objectives, or your financial situation. We aim to bring you long-term focused analysis driven by fundamental data. Note that our analysis may not factor in the latest price-sensitive company announcements or qualitative material. Simply Wall St has no position in any stocks mentioned.
About SEHK:3708
China Supply Chain Holdings
An investment holding company, provides building maintenance and renovation services in Hong Kong.
Flawless balance sheet and fair value.
Market Insights

Community Narratives


