- Hong Kong
- /
- Industrials
- /
- SEHK:274
Take Care Before Jumping Onto Renaissance Asia Silk Road Group Limited (HKG:274) Even Though It's 26% Cheaper


Unfortunately for some shareholders, the Renaissance Asia Silk Road Group Limited (HKG:274) share price has dived 26% in the last thirty days, prolonging recent pain. For any long-term shareholders, the last month ends a year to forget by locking in a 79% share price decline.
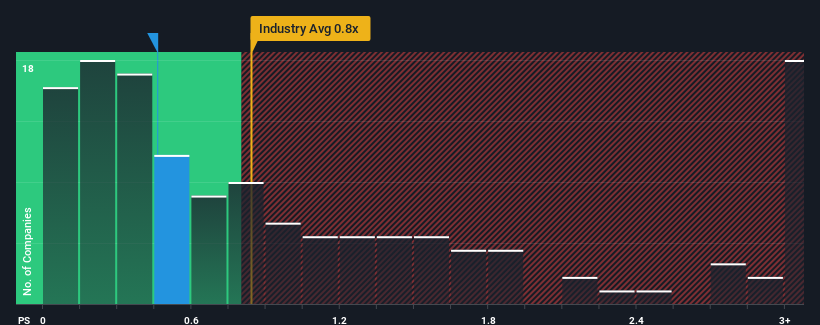
Although its price has dipped substantially, there still wouldn't be many who think Renaissance Asia Silk Road Group's price-to-sales (or "P/S") ratio of 0.5x is worth a mention when the median P/S in Hong Kong's Industrials industry is similar at about 0.4x. However, investors might be overlooking a clear opportunity or potential setback if there is no rational basis for the P/S.
See our latest analysis for Renaissance Asia Silk Road Group
How Has Renaissance Asia Silk Road Group Performed Recently?
Renaissance Asia Silk Road Group certainly has been doing a great job lately as it's been growing its revenue at a really rapid pace. Perhaps the market is expecting future revenue performance to taper off, which has kept the P/S from rising. Those who are bullish on Renaissance Asia Silk Road Group will be hoping that this isn't the case, so that they can pick up the stock at a lower valuation.
Want the full picture on earnings, revenue and cash flow for the company? Then our free report on Renaissance Asia Silk Road Group will help you shine a light on its historical performance.Is There Some Revenue Growth Forecasted For Renaissance Asia Silk Road Group?
In order to justify its P/S ratio, Renaissance Asia Silk Road Group would need to produce growth that's similar to the industry.
If we review the last year of revenue growth, the company posted a terrific increase of 96%. Spectacularly, three year revenue growth has ballooned by several orders of magnitude, thanks in part to the last 12 months of revenue growth. Therefore, it's fair to say the revenue growth recently has been superb for the company.
This is in contrast to the rest of the industry, which is expected to grow by 18% over the next year, materially lower than the company's recent medium-term annualised growth rates.
With this information, we find it interesting that Renaissance Asia Silk Road Group is trading at a fairly similar P/S compared to the industry. It may be that most investors are not convinced the company can maintain its recent growth rates.
What Does Renaissance Asia Silk Road Group's P/S Mean For Investors?
Following Renaissance Asia Silk Road Group's share price tumble, its P/S is just clinging on to the industry median P/S. Typically, we'd caution against reading too much into price-to-sales ratios when settling on investment decisions, though it can reveal plenty about what other market participants think about the company.
We've established that Renaissance Asia Silk Road Group currently trades on a lower than expected P/S since its recent three-year growth is higher than the wider industry forecast. When we see strong revenue with faster-than-industry growth, we can only assume potential risks are what might be placing pressure on the P/S ratio. At least the risk of a price drop looks to be subdued if recent medium-term revenue trends continue, but investors seem to think future revenue could see some volatility.
Plus, you should also learn about these 4 warning signs we've spotted with Renaissance Asia Silk Road Group.
If companies with solid past earnings growth is up your alley, you may wish to see this free collection of other companies with strong earnings growth and low P/E ratios.
If you're looking to trade Renaissance Asia Silk Road Group, open an account with the lowest-cost platform trusted by professionals, Interactive Brokers.
With clients in over 200 countries and territories, and access to 160 markets, IBKR lets you trade stocks, options, futures, forex, bonds and funds from a single integrated account.
Enjoy no hidden fees, no account minimums, and FX conversion rates as low as 0.03%, far better than what most brokers offer.
Sponsored ContentNew: AI Stock Screener & Alerts
Our new AI Stock Screener scans the market every day to uncover opportunities.
• Dividend Powerhouses (3%+ Yield)
• Undervalued Small Caps with Insider Buying
• High growth Tech and AI Companies
Or build your own from over 50 metrics.
Have feedback on this article? Concerned about the content? Get in touch with us directly. Alternatively, email editorial-team (at) simplywallst.com.
This article by Simply Wall St is general in nature. We provide commentary based on historical data and analyst forecasts only using an unbiased methodology and our articles are not intended to be financial advice. It does not constitute a recommendation to buy or sell any stock, and does not take account of your objectives, or your financial situation. We aim to bring you long-term focused analysis driven by fundamental data. Note that our analysis may not factor in the latest price-sensitive company announcements or qualitative material. Simply Wall St has no position in any stocks mentioned.
About SEHK:274
Renaissance Asia Silk Road Group
An investment holding company, engages in the exploration, mining, trading, and sale of gold products in the People's Republic of China.
Slight and slightly overvalued.
Market Insights

Community Narratives


