
Advertisement
- Hong Kong
- /
- Trade Distributors
- /
- SEHK:217
The one-year decline in earnings for China Chengtong Development Group HKG:217) isn't encouraging, but shareholders are still up 72% over that period
China Chengtong Development Group Limited (HKG:217) shareholders might be concerned after seeing the share price drop 15% in the last week. But that doesn't change the reality that over twelve months the stock has done really well. To wit, it had solidly beat the market, up 70%.
Although China Chengtong Development Group has shed HK$149m from its market cap this week, let's take a look at its longer term fundamental trends and see if they've driven returns.
While markets are a powerful pricing mechanism, share prices reflect investor sentiment, not just underlying business performance. One imperfect but simple way to consider how the market perception of a company has shifted is to compare the change in the earnings per share (EPS) with the share price movement.
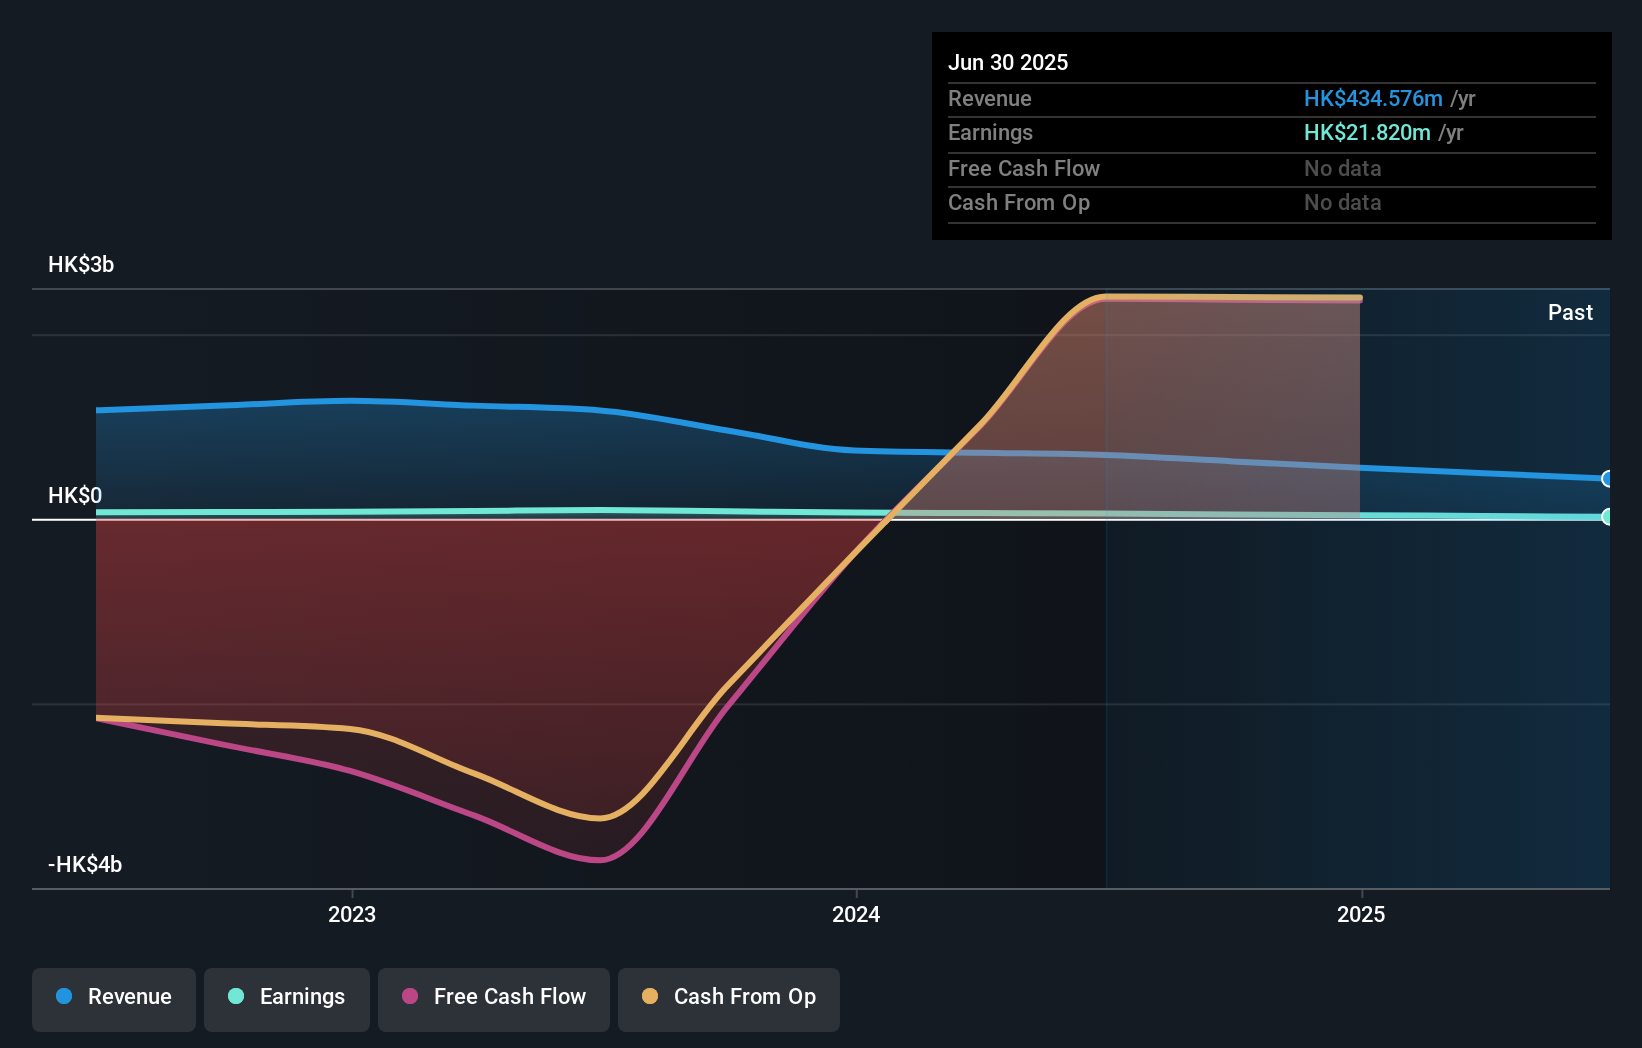
During the last year, China Chengtong Development Group actually saw its earnings per share drop 61%.
Given the share price gain, we doubt the market is measuring progress with EPS. Since the change in EPS doesn't seem to correlate with the change in share price, it's worth taking a look at other metrics.
We doubt the modest 1.4% dividend yield is doing much to support the share price. China Chengtong Development Group's revenue actually dropped 37% over last year. So using a snapshot of key business metrics doesn't give us a good picture of why the market is bidding up the stock.
The graphic below depicts how earnings and revenue have changed over time (unveil the exact values by clicking on the image).
Take a more thorough look at China Chengtong Development Group's financial health with this free report on its balance sheet.
What About Dividends?
As well as measuring the share price return, investors should also consider the total shareholder return (TSR). Whereas the share price return only reflects the change in the share price, the TSR includes the value of dividends (assuming they were reinvested) and the benefit of any discounted capital raising or spin-off. Arguably, the TSR gives a more comprehensive picture of the return generated by a stock. As it happens, China Chengtong Development Group's TSR for the last 1 year was 72%, which exceeds the share price return mentioned earlier. The dividends paid by the company have thusly boosted the total shareholder return.
A Different Perspective
It's nice to see that China Chengtong Development Group shareholders have received a total shareholder return of 72% over the last year. That's including the dividend. Notably the five-year annualised TSR loss of 2% per year compares very unfavourably with the recent share price performance. This makes us a little wary, but the business might have turned around its fortunes. I find it very interesting to look at share price over the long term as a proxy for business performance. But to truly gain insight, we need to consider other information, too. For example, we've discovered 4 warning signs for China Chengtong Development Group (2 are significant!) that you should be aware of before investing here.
For those who like to find winning investments this free list of undervalued companies with recent insider purchasing, could be just the ticket.
Please note, the market returns quoted in this article reflect the market weighted average returns of stocks that currently trade on Hong Kong exchanges.
New: AI Stock Screener & Alerts
Our new AI Stock Screener scans the market every day to uncover opportunities.
• Dividend Powerhouses (3%+ Yield)
• Undervalued Small Caps with Insider Buying
• High growth Tech and AI Companies
Or build your own from over 50 metrics.
Have feedback on this article? Concerned about the content? Get in touch with us directly. Alternatively, email editorial-team (at) simplywallst.com.
This article by Simply Wall St is general in nature. We provide commentary based on historical data and analyst forecasts only using an unbiased methodology and our articles are not intended to be financial advice. It does not constitute a recommendation to buy or sell any stock, and does not take account of your objectives, or your financial situation. We aim to bring you long-term focused analysis driven by fundamental data. Note that our analysis may not factor in the latest price-sensitive company announcements or qualitative material. Simply Wall St has no position in any stocks mentioned.
About SEHK:217
China Chengtong Development Group
An investment holding company, engages in the leasing, property development and investment, and marine recreation services and hotel business in the People’s Republic of China.
Adequate balance sheet with slight risk.
Market Insights

Advertisement
Community Narratives
The Next Phase of Energy Storage: How NeoVolta Is Tackling America’s Power Crunch
Fair Value US$7.50|35.1% undervalued
MA
Community Contributor
Why EnSilica is Worth Possibly 13x its Current Price
Fair Value UK£5.00|89.8% undervalued
DO
Community Contributor
M&A Activity, Industry Diversification & A Defense Contract Monopoly Will Push BWXT For Healthy Long-Term Growth
Fair Value US$220.00|15.2% undervalued
CL
Community Contributor
A case for Cassiar Gold Corp (TSXV: GLDC) to reach CAD$8-10 before 2030 (X30-37)
Fair Value CA$10.00|96.0% undervalued
AG
Community Contributor