
Advertisement
V.S. International Group Limited (HKG:1002) Stock Rockets 36% As Investors Are Less Pessimistic Than Expected

Those holding V.S. International Group Limited (HKG:1002) shares would be relieved that the share price has rebounded 36% in the last thirty days, but it needs to keep going to repair the recent damage it has caused to investor portfolios. Unfortunately, the gains of the last month did little to right the losses of the last year with the stock still down 11% over that time.
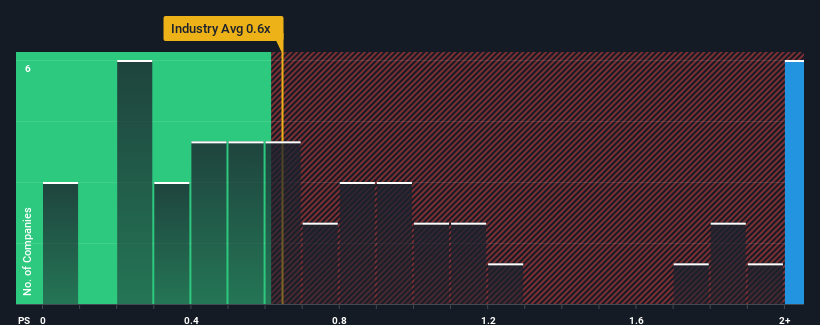
Since its price has surged higher, you could be forgiven for thinking V.S. International Group is a stock not worth researching with a price-to-sales ratios (or "P/S") of 2.5x, considering almost half the companies in Hong Kong's Machinery industry have P/S ratios below 0.6x. However, the P/S might be high for a reason and it requires further investigation to determine if it's justified.
View our latest analysis for V.S. International Group
How Has V.S. International Group Performed Recently?
V.S. International Group has been doing a good job lately as it's been growing revenue at a solid pace. One possibility is that the P/S ratio is high because investors think this respectable revenue growth will be enough to outperform the broader industry in the near future. If not, then existing shareholders may be a little nervous about the viability of the share price.
Although there are no analyst estimates available for V.S. International Group, take a look at this free data-rich visualisation to see how the company stacks up on earnings, revenue and cash flow.Do Revenue Forecasts Match The High P/S Ratio?
There's an inherent assumption that a company should outperform the industry for P/S ratios like V.S. International Group's to be considered reasonable.
If we review the last year of revenue growth, the company posted a worthy increase of 7.9%. Ultimately though, it couldn't turn around the poor performance of the prior period, with revenue shrinking 80% in total over the last three years. Therefore, it's fair to say the revenue growth recently has been undesirable for the company.
In contrast to the company, the rest of the industry is expected to grow by 13% over the next year, which really puts the company's recent medium-term revenue decline into perspective.
With this information, we find it concerning that V.S. International Group is trading at a P/S higher than the industry. Apparently many investors in the company are way more bullish than recent times would indicate and aren't willing to let go of their stock at any price. Only the boldest would assume these prices are sustainable as a continuation of recent revenue trends is likely to weigh heavily on the share price eventually.
The Final Word
The large bounce in V.S. International Group's shares has lifted the company's P/S handsomely. Generally, our preference is to limit the use of the price-to-sales ratio to establishing what the market thinks about the overall health of a company.
We've established that V.S. International Group currently trades on a much higher than expected P/S since its recent revenues have been in decline over the medium-term. When we see revenue heading backwards and underperforming the industry forecasts, we feel the possibility of the share price declining is very real, bringing the P/S back into the realm of reasonability. Unless the recent medium-term conditions improve markedly, investors will have a hard time accepting the share price as fair value.
You need to take note of risks, for example - V.S. International Group has 2 warning signs (and 1 which is significant) we think you should know about.
It's important to make sure you look for a great company, not just the first idea you come across. So if growing profitability aligns with your idea of a great company, take a peek at this free list of interesting companies with strong recent earnings growth (and a low P/E).
New: Manage All Your Stock Portfolios in One Place
We've created the ultimate portfolio companion for stock investors, and it's free.
• Connect an unlimited number of Portfolios and see your total in one currency
• Be alerted to new Warning Signs or Risks via email or mobile
• Track the Fair Value of your stocks
Have feedback on this article? Concerned about the content? Get in touch with us directly. Alternatively, email editorial-team (at) simplywallst.com.
This article by Simply Wall St is general in nature. We provide commentary based on historical data and analyst forecasts only using an unbiased methodology and our articles are not intended to be financial advice. It does not constitute a recommendation to buy or sell any stock, and does not take account of your objectives, or your financial situation. We aim to bring you long-term focused analysis driven by fundamental data. Note that our analysis may not factor in the latest price-sensitive company announcements or qualitative material. Simply Wall St has no position in any stocks mentioned.
About SEHK:1002
V.S. International Group
An investment holding company, manufactures, assembles, and sells plastic molded products and parts.
Adequate balance sheet very low.
Market Insights

Advertisement
Community Narratives
RIO is poised to weather a depressed iron ore environment, but commodity diversification comes with lower margins
Fair Value AU$110.51|4.0% overvalued
DU
Community Contributor
The demand for personalized medicine will keep Thermo Fisher Scientific thriving
Fair Value US$540.27|21.0% undervalued
UN
Community Contributor
Silver Play by A Family with 10x Potential
Fair Value UK£24.00|88.7% undervalued
RO
Community Contributor