
Advertisement
Performance Technologies (ATH:PERF) sheds 11% this week, as yearly returns fall more in line with earnings growth

Performance Technologies S.A. (ATH:PERF) shareholders might be concerned after seeing the share price drop 11% in the last week. But that doesn't change the fact that the returns over the last half decade have been spectacular. Indeed, the share price is up a whopping 469% in that time. So it might be that some shareholders are taking profits after good performance. But the real question is whether the business fundamentals can improve over the long term.
While the stock has fallen 11% this week, it's worth focusing on the longer term and seeing if the stocks historical returns have been driven by the underlying fundamentals.
Check out our latest analysis for Performance Technologies
To quote Buffett, 'Ships will sail around the world but the Flat Earth Society will flourish. There will continue to be wide discrepancies between price and value in the marketplace...' One way to examine how market sentiment has changed over time is to look at the interaction between a company's share price and its earnings per share (EPS).
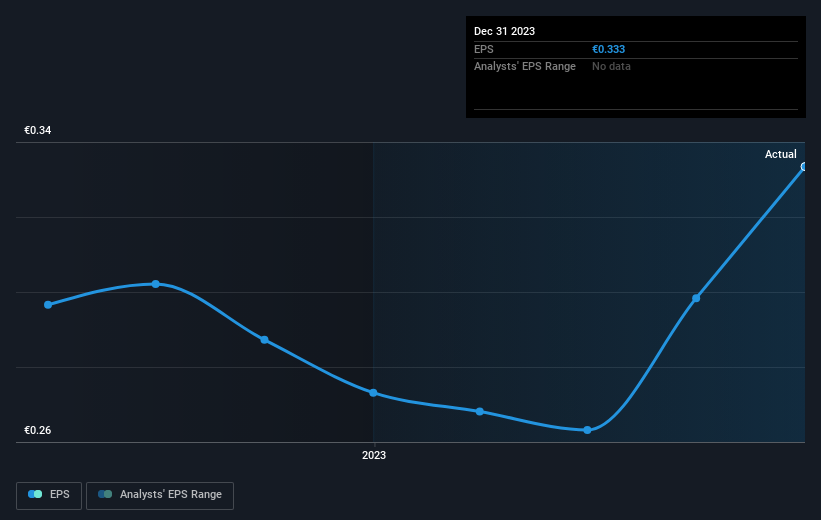
Over half a decade, Performance Technologies managed to grow its earnings per share at 22% a year. This EPS growth is slower than the share price growth of 42% per year, over the same period. So it's fair to assume the market has a higher opinion of the business than it did five years ago. That's not necessarily surprising considering the five-year track record of earnings growth.
You can see how EPS has changed over time in the image below (click on the chart to see the exact values).
Before buying or selling a stock, we always recommend a close examination of historic growth trends, available here.
What About Dividends?
As well as measuring the share price return, investors should also consider the total shareholder return (TSR). The TSR is a return calculation that accounts for the value of cash dividends (assuming that any dividend received was reinvested) and the calculated value of any discounted capital raisings and spin-offs. It's fair to say that the TSR gives a more complete picture for stocks that pay a dividend. As it happens, Performance Technologies' TSR for the last 5 years was 505%, which exceeds the share price return mentioned earlier. And there's no prize for guessing that the dividend payments largely explain the divergence!
A Different Perspective
It's good to see that Performance Technologies has rewarded shareholders with a total shareholder return of 24% in the last twelve months. Of course, that includes the dividend. However, that falls short of the 43% TSR per annum it has made for shareholders, each year, over five years. The pessimistic view would be that be that the stock has its best days behind it, but on the other hand the price might simply be moderating while the business itself continues to execute. While it is well worth considering the different impacts that market conditions can have on the share price, there are other factors that are even more important. For instance, we've identified 2 warning signs for Performance Technologies that you should be aware of.
If you like to buy stocks alongside management, then you might just love this free list of companies. (Hint: many of them are unnoticed AND have attractive valuation).
Please note, the market returns quoted in this article reflect the market weighted average returns of stocks that currently trade on Greek exchanges.
New: Manage All Your Stock Portfolios in One Place
We've created the ultimate portfolio companion for stock investors, and it's free.
• Connect an unlimited number of Portfolios and see your total in one currency
• Be alerted to new Warning Signs or Risks via email or mobile
• Track the Fair Value of your stocks
Have feedback on this article? Concerned about the content? Get in touch with us directly. Alternatively, email editorial-team (at) simplywallst.com.
This article by Simply Wall St is general in nature. We provide commentary based on historical data and analyst forecasts only using an unbiased methodology and our articles are not intended to be financial advice. It does not constitute a recommendation to buy or sell any stock, and does not take account of your objectives, or your financial situation. We aim to bring you long-term focused analysis driven by fundamental data. Note that our analysis may not factor in the latest price-sensitive company announcements or qualitative material. Simply Wall St has no position in any stocks mentioned.
Have feedback on this article? Concerned about the content? Get in touch with us directly. Alternatively, email editorial-team@simplywallst.com
About ATSE:PERF
Excellent balance sheet and slightly overvalued.
Market Insights

Advertisement
Community Narratives
PPG Industries set to soar with 9% revenue growth in the next 3 years
Fair Value US$152.76|28.5% undervalued
DM
Community Contributor
Predicting a Steady Future for Crocs with Modest Growth and a 10% Discount Rate
Fair Value US$151.43|33.3% undervalued
JO
Community Contributor