An Intrinsic Calculation For Strix Group Plc (LON:KETL) Suggests It's 27% Undervalued

Key Insights
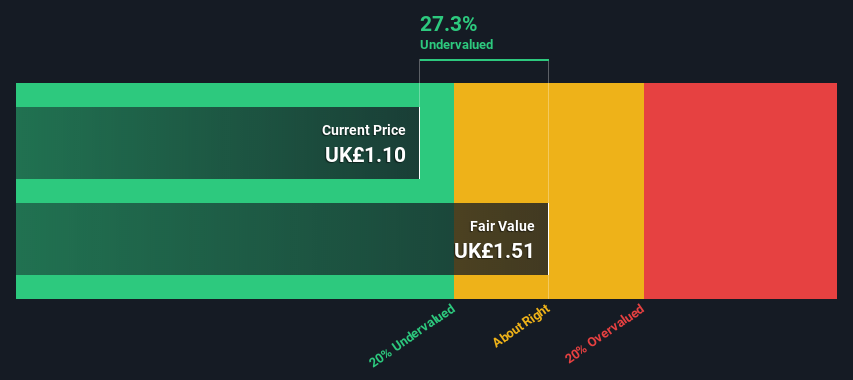
- Strix Group's estimated fair value is UK£1.51 based on 2 Stage Free Cash Flow to Equity
- Strix Group is estimated to be 27% undervalued based on current share price of UK£1.10
- Our fair value estimate is 17% higher than Strix Group's analyst price target of UK£1.29
Today we will run through one way of estimating the intrinsic value of Strix Group Plc (LON:KETL) by estimating the company's future cash flows and discounting them to their present value. Our analysis will employ the Discounted Cash Flow (DCF) model. Believe it or not, it's not too difficult to follow, as you'll see from our example!
Remember though, that there are many ways to estimate a company's value, and a DCF is just one method. Anyone interested in learning a bit more about intrinsic value should have a read of the Simply Wall St analysis model.
See our latest analysis for Strix Group
Crunching The Numbers
We use what is known as a 2-stage model, which simply means we have two different periods of growth rates for the company's cash flows. Generally the first stage is higher growth, and the second stage is a lower growth phase. To start off with, we need to estimate the next ten years of cash flows. Where possible we use analyst estimates, but when these aren't available we extrapolate the previous free cash flow (FCF) from the last estimate or reported value. We assume companies with shrinking free cash flow will slow their rate of shrinkage, and that companies with growing free cash flow will see their growth rate slow, over this period. We do this to reflect that growth tends to slow more in the early years than it does in later years.
Generally we assume that a dollar today is more valuable than a dollar in the future, so we discount the value of these future cash flows to their estimated value in today's dollars:
10-year free cash flow (FCF) forecast
| 2023 | 2024 | 2025 | 2026 | 2027 | 2028 | 2029 | 2030 | 2031 | 2032 | |
| Levered FCF (£, Millions) | UK£26.0m | UK£28.9m | UK£28.5m | UK£28.4m | UK£28.4m | UK£28.5m | UK£28.7m | UK£28.9m | UK£29.1m | UK£29.4m |
| Growth Rate Estimate Source | Analyst x6 | Analyst x6 | Analyst x1 | Est @ -0.45% | Est @ 0.03% | Est @ 0.37% | Est @ 0.60% | Est @ 0.77% | Est @ 0.88% | Est @ 0.96% |
| Present Value (£, Millions) Discounted @ 9.3% | UK£23.8 | UK£24.2 | UK£21.9 | UK£19.9 | UK£18.2 | UK£16.7 | UK£15.4 | UK£14.2 | UK£13.1 | UK£12.1 |
("Est" = FCF growth rate estimated by Simply Wall St)
Present Value of 10-year Cash Flow (PVCF) = UK£180m
The second stage is also known as Terminal Value, this is the business's cash flow after the first stage. For a number of reasons a very conservative growth rate is used that cannot exceed that of a country's GDP growth. In this case we have used the 5-year average of the 10-year government bond yield (1.2%) to estimate future growth. In the same way as with the 10-year 'growth' period, we discount future cash flows to today's value, using a cost of equity of 9.3%.
Terminal Value (TV)= FCF2032 × (1 + g) ÷ (r – g) = UK£29m× (1 + 1.2%) ÷ (9.3%– 1.2%) = UK£367m
Present Value of Terminal Value (PVTV)= TV / (1 + r)10= UK£367m÷ ( 1 + 9.3%)10= UK£151m
The total value is the sum of cash flows for the next ten years plus the discounted terminal value, which results in the Total Equity Value, which in this case is UK£331m. In the final step we divide the equity value by the number of shares outstanding. Compared to the current share price of UK£1.1, the company appears a touch undervalued at a 27% discount to where the stock price trades currently. Valuations are imprecise instruments though, rather like a telescope - move a few degrees and end up in a different galaxy. Do keep this in mind.
Important Assumptions
Now the most important inputs to a discounted cash flow are the discount rate, and of course, the actual cash flows. If you don't agree with these result, have a go at the calculation yourself and play with the assumptions. The DCF also does not consider the possible cyclicality of an industry, or a company's future capital requirements, so it does not give a full picture of a company's potential performance. Given that we are looking at Strix Group as potential shareholders, the cost of equity is used as the discount rate, rather than the cost of capital (or weighted average cost of capital, WACC) which accounts for debt. In this calculation we've used 9.3%, which is based on a levered beta of 1.365. Beta is a measure of a stock's volatility, compared to the market as a whole. We get our beta from the industry average beta of globally comparable companies, with an imposed limit between 0.8 and 2.0, which is a reasonable range for a stable business.
SWOT Analysis for Strix Group
- Debt is well covered by earnings.
- Dividends are covered by earnings and cash flows.
- Earnings declined over the past year.
- Dividend is low compared to the top 25% of dividend payers in the Electronic market.
- Shareholders have been diluted in the past year.
- Annual earnings are forecast to grow faster than the British market.
- Good value based on P/E ratio and estimated fair value.
- Debt is not well covered by operating cash flow.
- Revenue is forecast to grow slower than 20% per year.
Moving On:
Although the valuation of a company is important, it ideally won't be the sole piece of analysis you scrutinize for a company. DCF models are not the be-all and end-all of investment valuation. Instead the best use for a DCF model is to test certain assumptions and theories to see if they would lead to the company being undervalued or overvalued. If a company grows at a different rate, or if its cost of equity or risk free rate changes sharply, the output can look very different. Why is the intrinsic value higher than the current share price? For Strix Group, we've compiled three pertinent aspects you should look at:
- Risks: For example, we've discovered 4 warning signs for Strix Group (1 makes us a bit uncomfortable!) that you should be aware of before investing here.
- Future Earnings: How does KETL's growth rate compare to its peers and the wider market? Dig deeper into the analyst consensus number for the upcoming years by interacting with our free analyst growth expectation chart.
- Other Solid Businesses: Low debt, high returns on equity and good past performance are fundamental to a strong business. Why not explore our interactive list of stocks with solid business fundamentals to see if there are other companies you may not have considered!
PS. Simply Wall St updates its DCF calculation for every British stock every day, so if you want to find the intrinsic value of any other stock just search here.
Mobile Infrastructure for Defense and Disaster
The next wave in robotics isn't humanoid. Its fully autonomous towers delivering 5G, ISR, and radar in under 30 minutes, anywhere.
Get the investor briefing before the next round of contracts
Sponsored On Behalf of CiTechNew: Manage All Your Stock Portfolios in One Place
We've created the ultimate portfolio companion for stock investors, and it's free.
• Connect an unlimited number of Portfolios and see your total in one currency
• Be alerted to new Warning Signs or Risks via email or mobile
• Track the Fair Value of your stocks
Have feedback on this article? Concerned about the content? Get in touch with us directly. Alternatively, email editorial-team (at) simplywallst.com.
This article by Simply Wall St is general in nature. We provide commentary based on historical data and analyst forecasts only using an unbiased methodology and our articles are not intended to be financial advice. It does not constitute a recommendation to buy or sell any stock, and does not take account of your objectives, or your financial situation. We aim to bring you long-term focused analysis driven by fundamental data. Note that our analysis may not factor in the latest price-sensitive company announcements or qualitative material. Simply Wall St has no position in any stocks mentioned.
About AIM:KETL
Strix Group
Designs, manufactures, and supplies kettle safety controls and other components worldwide.
Very undervalued with adequate balance sheet.
Market Insights

Weekly Picks

THE KINGDOM OF BROWN GOODS: WHY MGPI IS BEING CRUSHED BY INVENTORY & PRIMED FOR RESURRECTION


Why Vertical Aerospace (NYSE: EVTL) is Worth Possibly Over 13x its Current Price


The Quiet Giant That Became AI’s Power Grid
Recently Updated Narratives

Jackson Financial Stock: When Insurance Math Meets a Shifting Claims Landscape

Stride Stock: Online Education Finds Its Second Act

CS Disco Stock: Legal AI Is Moving From Efficiency Tool to Competitive Necessity
Popular Narratives


MicroVision will explode future revenue by 380.37% with a vision towards success


Crazy Undervalued 42 Baggers Silver Play (Active & Running Mine)


