- United Kingdom
- /
- Aerospace & Defense
- /
- LSE:BAB
3 UK Stocks Estimated To Be Trading At Discounts Of Up To 40.4%

Reviewed by Simply Wall St

The UK stock market has recently faced challenges, with the FTSE 100 index slipping due to weak trade data from China, highlighting concerns about global economic recovery. In such a climate, identifying undervalued stocks can be crucial for investors looking to capitalize on potential long-term growth opportunities amidst broader market uncertainties.
Top 10 Undervalued Stocks Based On Cash Flows In The United Kingdom
| Name | Current Price | Fair Value (Est) | Discount (Est) |
| On the Beach Group (LSE:OTB) | £1.53 | £3.06 | 50% |
| Watches of Switzerland Group (LSE:WOSG) | £4.328 | £8.43 | 48.7% |
| S&U (LSE:SUS) | £19.05 | £36.51 | 47.8% |
| Chemring Group (LSE:CHG) | £3.71 | £6.81 | 45.6% |
| Redcentric (AIM:RCN) | £1.20 | £2.39 | 49.8% |
| Gulf Keystone Petroleum (LSE:GKP) | £1.264 | £2.49 | 49.2% |
| Informa (LSE:INF) | £8.272 | £15.38 | 46.2% |
| Foxtons Group (LSE:FOXT) | £0.612 | £1.19 | 48.6% |
| St. James's Place (LSE:STJ) | £8.56 | £16.43 | 47.9% |
| Genel Energy (LSE:GENL) | £0.778 | £1.52 | 48.8% |
Underneath we present a selection of stocks filtered out by our screen.
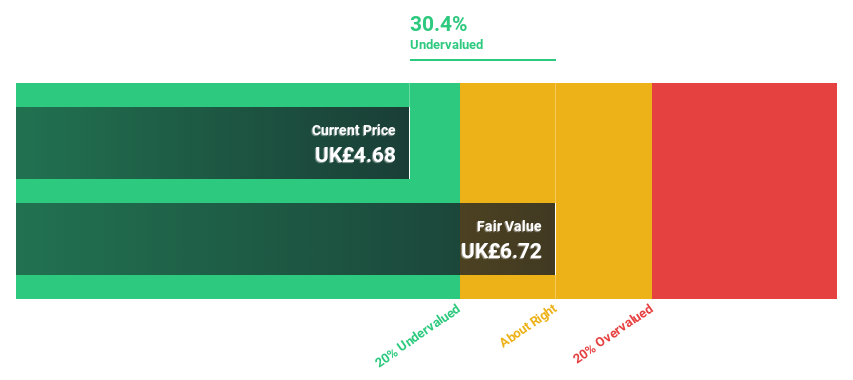
Babcock International Group (LSE:BAB)
Overview: Babcock International Group PLC, with a market cap of £2.45 billion, is involved in the design, development, manufacture, and integration of specialist systems for aerospace, defense, and security across the UK and internationally.
Operations: The company's revenue is derived from four main segments: Land (£1.10 billion), Marine (£1.43 billion), Nuclear (£1.52 billion), and Aviation (£341.50 million).
Estimated Discount To Fair Value: 40.4%
Babcock International Group is trading at £4.87, significantly below its estimated fair value of £8.16, suggesting potential undervaluation based on cash flows. Despite high debt levels, the company shows promising earnings growth forecasted at 16.1% annually, surpassing UK market expectations. Recent profitability and a new auditor appointment highlight operational improvements and governance focus. However, revenue growth remains modest at 4.1% per year compared to peers and industry standards in the UK market.
- Our earnings growth report unveils the potential for significant increases in Babcock International Group's future results.
- Delve into the full analysis health report here for a deeper understanding of Babcock International Group.
Barratt Redrow (LSE:BTRW)
Overview: Barratt Redrow plc operates in the housebuilding industry within the United Kingdom, with a market capitalization of £6.95 billion.
Operations: The company generates revenue from its housebuilding segment, totaling £4.17 billion.
Estimated Discount To Fair Value: 34.3%
Barratt Redrow, trading at £4.81, is considerably undervalued with an estimated fair value of £7.32. Despite recent earnings challenges and reduced dividends, the company is forecasted to achieve significant annual profit growth of 44.5%, outpacing the UK market average of 14%. However, net profit margins have declined from 10% to 2.7%, and shareholder dilution has occurred over the past year, impacting financial stability in the short term.
- Our expertly prepared growth report on Barratt Redrow implies its future financial outlook may be stronger than recent results.
- Click to explore a detailed breakdown of our findings in Barratt Redrow's balance sheet health report.
Moonpig Group (LSE:MOON)
Overview: Moonpig Group PLC operates as an online retailer of greeting cards and gifts in the Netherlands and the United Kingdom, with a market cap of £862.26 million.
Operations: The company's revenue segments include £51.24 million from Greetz, £241.33 million from Moonpig, and £48.58 million from Experiences.
Estimated Discount To Fair Value: 33.6%
Moonpig Group, trading at £2.50, is undervalued with a fair value estimate of £3.76, suggesting potential upside. Earnings are projected to grow annually by 18.5%, outpacing the UK market's average growth rate of 14.1%. However, the company carries a high level of debt which may affect financial flexibility. Despite slower revenue growth forecasts at 7.5% per year, Moonpig's return on equity is expected to be very high in three years at 74.9%.
- In light of our recent growth report, it seems possible that Moonpig Group's financial performance will exceed current levels.
- Take a closer look at Moonpig Group's balance sheet health here in our report.
Key Takeaways
- Discover the full array of 57 Undervalued UK Stocks Based On Cash Flows right here.
- Are any of these part of your asset mix? Tap into the analytical power of Simply Wall St's portfolio to get a 360-degree view on how they're shaping up.
- Unlock the power of informed investing with Simply Wall St, your free guide to navigating stock markets worldwide.
Searching for a Fresh Perspective?
- Explore high-performing small cap companies that haven't yet garnered significant analyst attention.
- Diversify your portfolio with solid dividend payers offering reliable income streams to weather potential market turbulence.
- Fuel your portfolio with companies showing strong growth potential, backed by optimistic outlooks both from analysts and management.
This article by Simply Wall St is general in nature. We provide commentary based on historical data and analyst forecasts only using an unbiased methodology and our articles are not intended to be financial advice. It does not constitute a recommendation to buy or sell any stock, and does not take account of your objectives, or your financial situation. We aim to bring you long-term focused analysis driven by fundamental data. Note that our analysis may not factor in the latest price-sensitive company announcements or qualitative material. Simply Wall St has no position in any stocks mentioned.
Valuation is complex, but we're here to simplify it.
Discover if Babcock International Group might be undervalued or overvalued with our detailed analysis, featuring fair value estimates, potential risks, dividends, insider trades, and its financial condition.
Access Free AnalysisHave feedback on this article? Concerned about the content? Get in touch with us directly. Alternatively, email editorial-team@simplywallst.com
About LSE:BAB
Babcock International Group
Engages in the design, development, manufacture, and integration of specialist systems for aerospace, defense, and security in the United Kingdom, rest of Europe, Africa, North America, Australasia, and internationally.
Very undervalued with solid track record.

